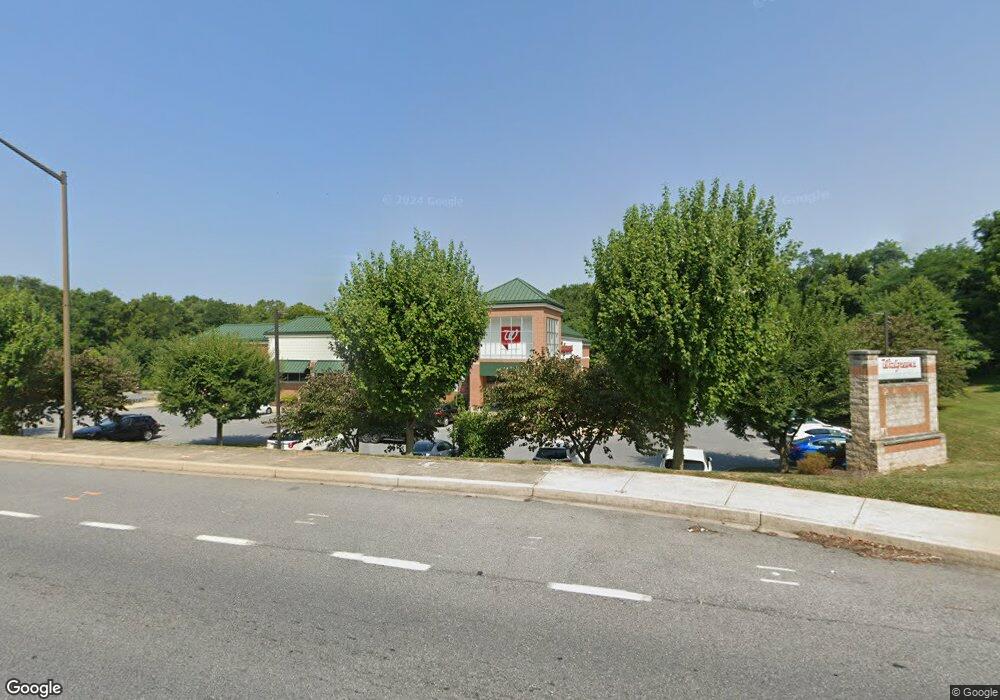
5585 Twin Knolls Rd Columbia, MD 21045
Oakland Mills NeighborhoodEstimated Value: $11,978,435
--
Bed
--
Bath
14,748
Sq Ft
$812/Sq Ft
Est. Value
About This Home
This home is located at 5585 Twin Knolls Rd, Columbia, MD 21045 and is currently estimated at $11,978,435, approximately $812 per square foot. 5585 Twin Knolls Rd is a home located in Howard County with nearby schools including Talbott Springs Elementary School, Oakland Mills Middle School, and Oakland Mills High School.
Ownership History
Date
Name
Owned For
Owner Type
Purchase Details
Closed on
Dec 27, 2019
Sold by
5585 Twin Knolls Llc
Bought by
Stancills Inc
Current Estimated Value
Purchase Details
Closed on
Jul 26, 2010
Sold by
Thunder Hill Llc
Bought by
5585 Twin Knolls Llc and C/O Walgreen Co Store #11949
Home Financials for this Owner
Home Financials are based on the most recent Mortgage that was taken out on this home.
Original Mortgage
$4,250,000
Interest Rate
4.73%
Mortgage Type
Commercial
Purchase Details
Closed on
Mar 7, 2006
Sold by
Fcnb Bank
Bought by
Thunder Hill Llc
Home Financials for this Owner
Home Financials are based on the most recent Mortgage that was taken out on this home.
Original Mortgage
$4,300,000
Interest Rate
6.16%
Mortgage Type
Purchase Money Mortgage
Purchase Details
Closed on
Feb 11, 1999
Sold by
Elkridge National Bank
Bought by
Fcnb Bank
Create a Home Valuation Report for This Property
The Home Valuation Report is an in-depth analysis detailing your home's value as well as a comparison with similar homes in the area
Home Values in the Area
Average Home Value in this Area
Purchase History
| Date | Buyer | Sale Price | Title Company |
|---|---|---|---|
| Stancills Inc | $8,675,000 | None Available | |
| 5585 Twin Knolls Llc | $6,071,400 | -- | |
| Thunder Hill Llc | $2,701,000 | -- | |
| Fcnb Bank | -- | -- |
Source: Public Records
Mortgage History
| Date | Status | Borrower | Loan Amount |
|---|---|---|---|
| Previous Owner | 5585 Twin Knolls Llc | $4,250,000 | |
| Previous Owner | Thunder Hill Llc | $4,300,000 |
Source: Public Records
Tax History Compared to Growth
Tax History
| Year | Tax Paid | Tax Assessment Tax Assessment Total Assessment is a certain percentage of the fair market value that is determined by local assessors to be the total taxable value of land and additions on the property. | Land | Improvement |
|---|---|---|---|---|
| 2025 | $91,320 | $6,490,400 | $0 | $0 |
| 2024 | $91,320 | $6,021,800 | $0 | $0 |
| 2023 | $81,596 | $5,553,200 | $1,536,500 | $4,016,700 |
| 2022 | $72,792 | $4,941,567 | $0 | $0 |
| 2021 | $59,609 | $4,329,933 | $0 | $0 |
| 2020 | $55,214 | $3,718,300 | $1,536,500 | $2,181,800 |
| 2019 | $53,618 | $3,718,300 | $1,536,500 | $2,181,800 |
| 2018 | $52,938 | $3,718,300 | $1,536,500 | $2,181,800 |
| 2017 | $52,429 | $3,720,300 | $0 | $0 |
| 2016 | $11,505 | $3,681,333 | $0 | $0 |
| 2015 | $11,505 | $3,642,367 | $0 | $0 |
| 2014 | $11,224 | $3,603,400 | $0 | $0 |
Source: Public Records
Map
Nearby Homes
- 5450 Bluecoat Ln
- 5454 Crowflock Ct
- 5510 Bluecoat Ln
- 5258 Patriot Ln
- 9653 Whiteacre Rd Unit C2
- 5866 Thunder Hill Rd Unit A4
- 5497 Vantage Point Rd
- 5491 Vantage Point Rd
- 5546 Phelps Luck Dr
- 5423 Smooth Meadow Way
- 5421 Smooth Meadow Way
- 5390 Smooth Meadow Way Unit 2
- 9440 Dartmouth Rd
- 9111 Goldamber Garth
- 9550 Transfer Row
- 5505 April Journey
- 9029 Flicker Place
- 9068 Goldamber Garth
- 9477 Battler Ct
- 5522 April Journey
- 5571 Thunder Hill Rd
- 5575 Thunder Hill Rd
- 5571 Oakland Mills Rd
- 5579 Thunder Hill Rd
- 5575 Oakland Mills Rd
- 5567 Oakland Mills Rd
- 9485 Old Deep Ct
- 9484 Old Deep Ct
- 5559 Oakland Mills Rd
- 5583 Thunder Hill Rd
- 5555 Oakland Mills Rd
- 9481 Old Deep Ct
- 9480 Old Deep Ct
- 5485 Bright Hawk Ct
- 5489 Bright Hawk Ct
- 5576 Oakland Mills Rd
- 5481 Bright Hawk Ct
- 9405 Wandering Way
- 9477 Old Deep Ct
- 5588 Thunder Hill Rd