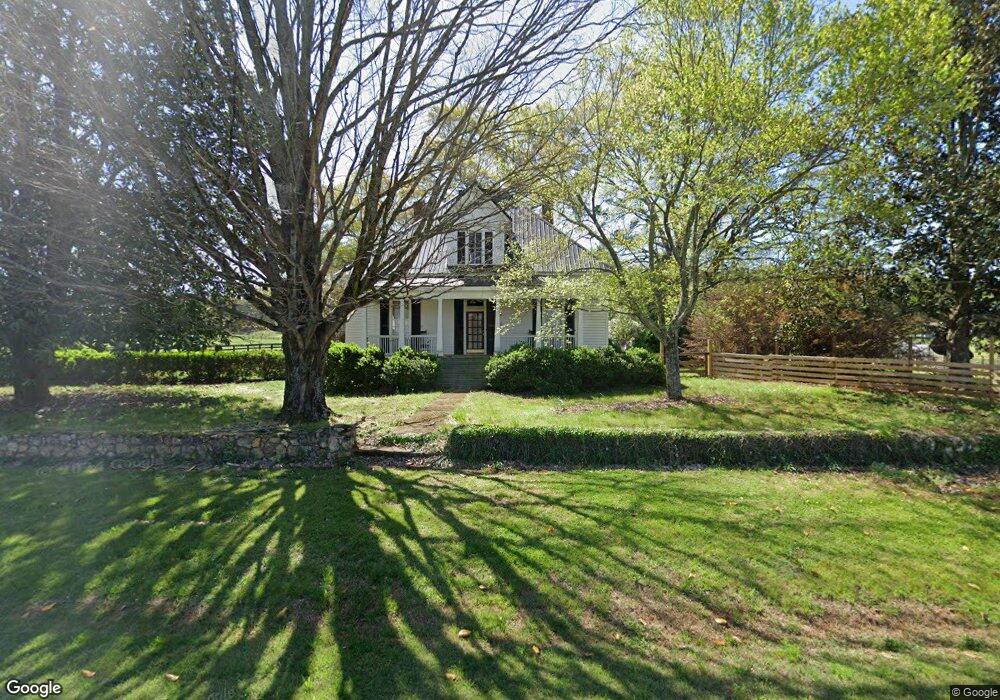
5587 Cave Spring Rd SW Unit B Cave Spring, GA 30124
Estimated Value: $486,482 - $552,000
--
Bed
2
Baths
2,702
Sq Ft
$196/Sq Ft
Est. Value
About This Home
This home is located at 5587 Cave Spring Rd SW Unit B, Cave Spring, GA 30124 and is currently estimated at $528,621, approximately $195 per square foot. 5587 Cave Spring Rd SW Unit B is a home located in Floyd County with nearby schools including Coosa Middle School and Coosa High School.
Ownership History
Date
Name
Owned For
Owner Type
Purchase Details
Closed on
Aug 30, 2019
Sold by
Owen Charles Glenn
Bought by
Lunceford Roger W and Lunceford Vickie F
Current Estimated Value
Home Financials for this Owner
Home Financials are based on the most recent Mortgage that was taken out on this home.
Original Mortgage
$271,819
Outstanding Balance
$236,507
Interest Rate
3.7%
Mortgage Type
New Conventional
Estimated Equity
$292,114
Purchase Details
Closed on
Jul 15, 2003
Sold by
Erwin Paul L
Bought by
Owen Charles Glenn and Mary Beth Owen
Purchase Details
Closed on
May 30, 2002
Sold by
Williams Charles S and Smith Dorothy W
Bought by
Erwin Paul L
Purchase Details
Closed on
Jun 25, 2001
Bought by
P and R
Purchase Details
Closed on
Dec 30, 1996
Sold by
Williams Charles S
Bought by
Williams Charles S and Williams Dorothy W
Purchase Details
Closed on
Jun 15, 1987
Bought by
Williams Charles S
Create a Home Valuation Report for This Property
The Home Valuation Report is an in-depth analysis detailing your home's value as well as a comparison with similar homes in the area
Purchase History
| Date | Buyer | Sale Price | Title Company |
|---|---|---|---|
| Lunceford Roger W | $362,425 | -- | |
| Owen Charles Glenn | $129,000 | -- | |
| Erwin Paul L | $57,500 | -- | |
| P | -- | -- | |
| Williams Charles S | -- | -- | |
| Williams Charles S | $65,000 | -- |
Source: Public Records
Mortgage History
| Date | Status | Borrower | Loan Amount |
|---|---|---|---|
| Open | Lunceford Roger W | $271,819 |
Source: Public Records
Tax History
| Year | Tax Paid | Tax Assessment Tax Assessment Total Assessment is a certain percentage of the fair market value that is determined by local assessors to be the total taxable value of land and additions on the property. | Land | Improvement |
|---|---|---|---|---|
| 2025 | $4,698 | $228,689 | $16,647 | $212,042 |
| 2024 | $4,698 | $213,457 | $14,797 | $198,660 |
| 2023 | $4,589 | $206,762 | $13,452 | $193,310 |
| 2022 | $3,960 | $174,438 | $11,186 | $163,252 |
| 2021 | $3,133 | $131,888 | $10,202 | $121,686 |
| 2020 | $3,031 | $125,560 | $8,871 | $116,689 |
| 2019 | $833 | $57,625 | $8,871 | $48,754 |
| 2018 | $1,456 | $54,087 | $8,449 | $45,638 |
| 2017 | $1,411 | $52,442 | $7,824 | $44,618 |
| 2016 | $1,329 | $47,651 | $7,800 | $39,851 |
| 2015 | $1,303 | $47,651 | $7,800 | $39,851 |
| 2014 | $1,303 | $47,651 | $7,800 | $39,851 |
Source: Public Records
Map
Nearby Homes
- 475 Davis Rd SW
- 0 Booger Hollow Rd SW Unit 17969096
- 0 Blacks Bluff Rd SW Unit 17015073
- 47 Boyd Rd SW
- 0 Old Blacks Bluff Rd SW Unit 10652523
- 4458 Old Blacks Bluff Rd SW
- 2081 Blacks Bluff Rd SW Unit LOT A
- 2081 Blacks Bluff Lot A Rd SW
- 262 Blacks Bluff Rd SW
- 0 Booger Hollow Rd
- 4803 Cedartown Hwy SE
- 0 College View Dr SW Unit 10655489
- 0 College View Dr SW Unit 10655483
- 3428 Horseleg Creek Rd SW
- 5854 Cedartown Hwy SW
- 0 Doyle Rd Unit 26660497
- 5866 Hwy 27 S
- 0 Mill Rd Unit 10629874
- 0 Mill Rd Unit 7670319
- 1039 Livingston Rd SW
- 5587 Cave Spring Rd SW
- 5614 Cave Spring Rd SW
- 5627 Cave Spring Rd SW
- 5665 Cave Spring Rd SW
- 5555 Cave Spring Rd SW
- 5436 Cave Spring Rd SW
- 5300 Cave Spring Rd SW
- 5360 Cave Spring Rd SW
- 5360 Cave Spring Rd SW
- 132 Morgan Dairy Rd SW
- 0000 Morgan Dairy Rd SW
- 300 Webb Creek Rd SW
- 6039 Cave Spring Rd SW
- 496 Morgan Dairy Rd SW
- 496 Morgan Dairy Rd SW
- 496 Morgan Dairy Rd SW
- 640 Morgan Dairy Rd SW
- 6181 Cave Spring Rd SW
- 0 Morgan Dairy Rd SW Unit 8278226
- 0 Morgan Dairy Rd SW Unit 2536362
Your Personal Tour Guide
Ask me questions while you tour the home.