Estimated Value: $752,000 - $819,000
8
Beds
4
Baths
4,078
Sq Ft
$195/Sq Ft
Est. Value
About This Home
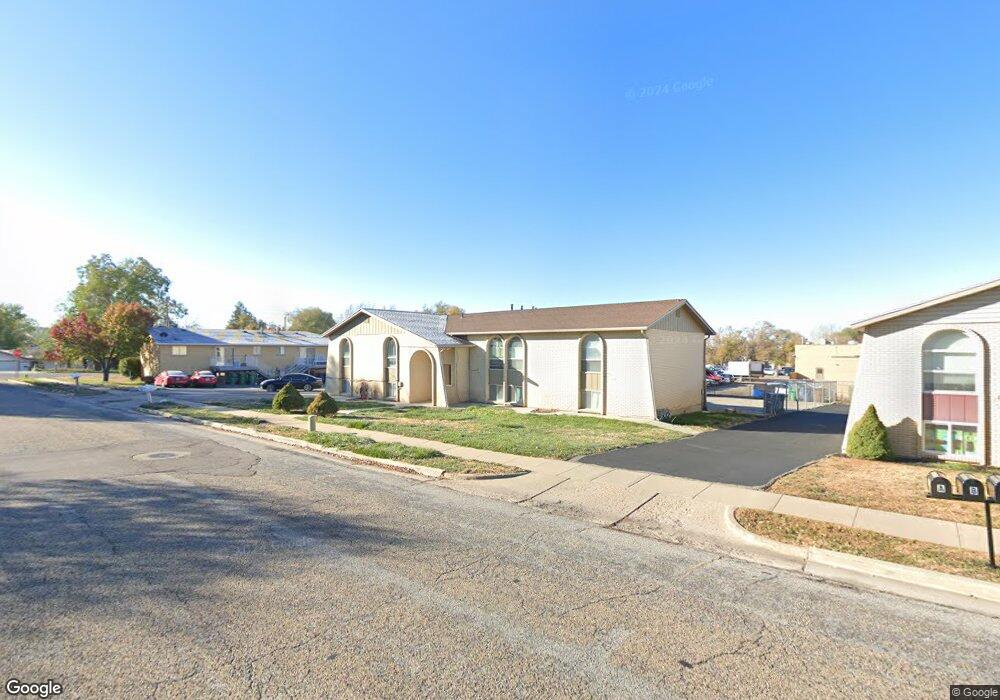
This home is located at 5587 S 2800 W, Roy, UT 84067 and is currently estimated at $793,333, approximately $194 per square foot. 5587 S 2800 W is a home located in Weber County with nearby schools including Roy Elementary School, Roy Junior High School, and Roy High School.
Ownership History
Date
Name
Owned For
Owner Type
Purchase Details
Closed on
Feb 2, 2024
Sold by
English Christopher S and Schouten Vivian A
Bought by
Est Real Estate Llc
Current Estimated Value
Purchase Details
Closed on
Feb 18, 2022
Sold by
Orville Moss Kevin
Bought by
English Christopher S and Schouten Vivian A
Home Financials for this Owner
Home Financials are based on the most recent Mortgage that was taken out on this home.
Original Mortgage
$561,000
Interest Rate
3.69%
Mortgage Type
New Conventional
Purchase Details
Closed on
Apr 26, 2019
Sold by
Hard Kathie A and Pilcher Survivor S T Orville J
Bought by
Moss Kevin Orville
Purchase Details
Closed on
Jan 20, 2004
Sold by
Pilcher Orville J and Pilcher Mary D
Bought by
Pilcher Orville J and Pilcher Mary D
Create a Home Valuation Report for This Property
The Home Valuation Report is an in-depth analysis detailing your home's value as well as a comparison with similar homes in the area
Home Values in the Area
Average Home Value in this Area
Purchase History
| Date | Buyer | Sale Price | Title Company |
|---|---|---|---|
| Est Real Estate Llc | -- | None Listed On Document | |
| English Christopher S | -- | None Listed On Document | |
| Moss Kevin Orville | -- | None Available | |
| Pilcher Orville J | -- | Bonneville Title |
Source: Public Records
Mortgage History
| Date | Status | Borrower | Loan Amount |
|---|---|---|---|
| Previous Owner | English Christopher S | $561,000 |
Source: Public Records
Tax History
| Year | Tax Paid | Tax Assessment Tax Assessment Total Assessment is a certain percentage of the fair market value that is determined by local assessors to be the total taxable value of land and additions on the property. | Land | Improvement |
|---|---|---|---|---|
| 2025 | $5,055 | $843,700 | $200,000 | $643,700 |
| 2024 | $4,927 | $828,000 | $200,000 | $628,000 |
| 2023 | $4,302 | $720,000 | $148,000 | $572,000 |
| 2022 | $4,427 | $760,000 | $100,000 | $660,000 |
| 2021 | $3,825 | $597,000 | $100,000 | $497,000 |
| 2020 | $3,215 | $457,000 | $75,656 | $381,344 |
| 2019 | $2,962 | $395,600 | $45,607 | $349,993 |
| 2018 | $2,363 | $293,071 | $45,607 | $247,464 |
| 2017 | $2,031 | $234,000 | $43,501 | $190,499 |
| 2016 | $2,063 | $128,547 | $22,000 | $106,547 |
| 2015 | $1,749 | $110,482 | $22,000 | $88,482 |
| 2014 | $2,010 | $127,606 | $22,000 | $105,606 |
Source: Public Records
Map
Nearby Homes
- 5579 S 2800 W
- 2812 W 5600 S
- 2824 W 5600 S
- 5586 S 2800 W Unit 4
- 5586 S 2800 W Unit 3A
- 5586 S 2800 W Unit 2
- 5586 S 2800 W Unit 1
- 5586 S 2800 W
- 2850 W 5600 S
- 5568 S 2800 W Unit 8
- 5568 S 2800 W Unit 7B
- 5568 S 2800 W Unit 6B
- 5568 S 2800 W Unit B-7
- 5568 S 2800 W
- 5568 S 2800 W Unit 5
- 5568 S 2800 W Unit B-5
- 2846 W 5600 S
- 5571 S 2800 W Unit C
- 5571 S 2800 W
- 5546 S 2800 W
Your Personal Tour Guide
Ask me questions while you tour the home.