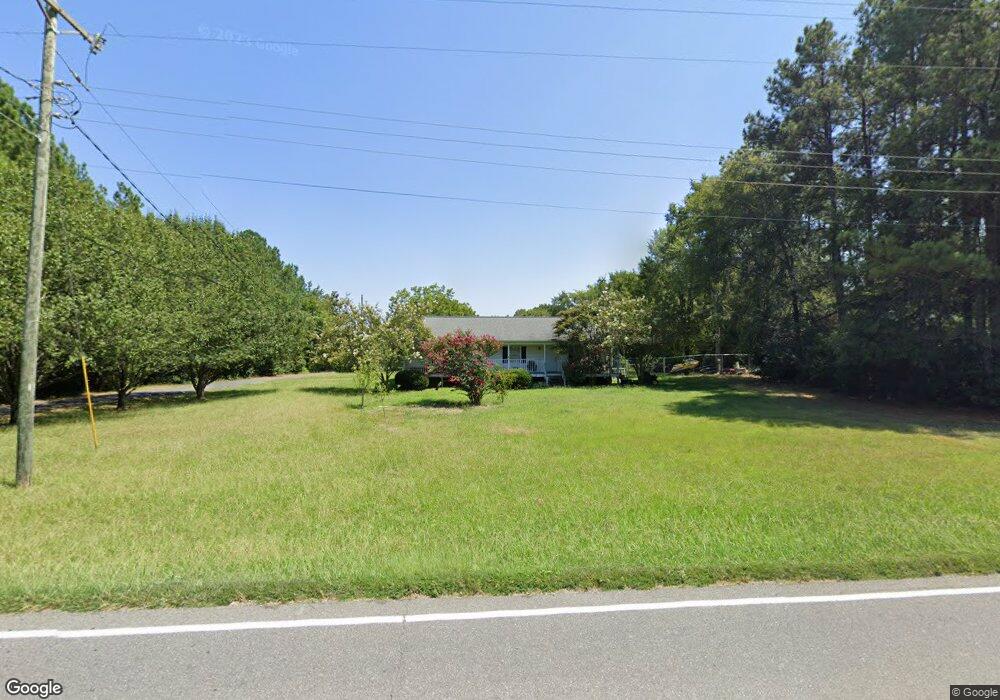
5589 Flowes Store Rd Concord, NC 28025
Estimated Value: $287,000 - $364,000
3
Beds
2
Baths
1,248
Sq Ft
$254/Sq Ft
Est. Value
About This Home
This home is located at 5589 Flowes Store Rd, Concord, NC 28025 and is currently estimated at $316,630, approximately $253 per square foot. 5589 Flowes Store Rd is a home located in Cabarrus County with nearby schools including A.T. Allen Elementary School, C.C. Griffin Middle School, and Central Cabarrus High School.
Ownership History
Date
Name
Owned For
Owner Type
Purchase Details
Closed on
Feb 19, 2010
Sold by
Carey James and Carey Elizabeth
Bought by
Kolbe Charles Edward
Current Estimated Value
Home Financials for this Owner
Home Financials are based on the most recent Mortgage that was taken out on this home.
Original Mortgage
$100,096
Interest Rate
5.07%
Mortgage Type
Purchase Money Mortgage
Purchase Details
Closed on
Oct 31, 2000
Sold by
Mcanulty Steele Sherri Jane and Mcanulty Nelson M
Bought by
Carey James and Stafford Elizabeth A
Home Financials for this Owner
Home Financials are based on the most recent Mortgage that was taken out on this home.
Original Mortgage
$90,943
Interest Rate
7.94%
Mortgage Type
FHA
Create a Home Valuation Report for This Property
The Home Valuation Report is an in-depth analysis detailing your home's value as well as a comparison with similar homes in the area
Home Values in the Area
Average Home Value in this Area
Purchase History
| Date | Buyer | Sale Price | Title Company |
|---|---|---|---|
| Kolbe Charles Edward | $100,000 | None Available | |
| Carey James | $91,000 | -- |
Source: Public Records
Mortgage History
| Date | Status | Borrower | Loan Amount |
|---|---|---|---|
| Closed | Kolbe Charles Edward | $100,096 | |
| Previous Owner | Carey James | $90,943 |
Source: Public Records
Tax History
| Year | Tax Paid | Tax Assessment Tax Assessment Total Assessment is a certain percentage of the fair market value that is determined by local assessors to be the total taxable value of land and additions on the property. | Land | Improvement |
|---|---|---|---|---|
| 2025 | $1,733 | $252,570 | $54,720 | $197,850 |
| 2024 | $1,733 | $252,570 | $54,720 | $197,850 |
| 2023 | $1,265 | $148,850 | $30,240 | $118,610 |
| 2022 | $1,235 | $148,850 | $30,240 | $118,610 |
| 2021 | $1,213 | $148,850 | $30,240 | $118,610 |
| 2020 | $1,213 | $148,850 | $30,240 | $118,610 |
| 2019 | $1,024 | $125,640 | $36,000 | $89,640 |
| 2018 | $999 | $125,640 | $36,000 | $89,640 |
| 2017 | $945 | $125,130 | $36,000 | $89,130 |
| 2016 | $945 | $120,820 | $36,000 | $84,820 |
| 2015 | $900 | $120,820 | $36,000 | $84,820 |
| 2014 | $900 | $120,820 | $36,000 | $84,820 |
Source: Public Records
Map
Nearby Homes
- 5696 Flowes Store Rd
- 5582 Flowes Store Rd
- 876 Pointe Andrews Dr
- 5707 Saint Adriens Way
- 5822 Meeting St
- 5917 Ashebrook Dr
- 5248 Ellie Ct
- 1562 Piney Church Rd
- 707 Pointe Andrews Dr SW
- 660 Pointe Andrews Dr
- 1009 Braxton Dr
- 6311 Rocky Wagon Ln SW
- 1049 River Haven Ave SW Unit 140
- 6343 Clarisse Dr SW
- 1234 Piney Church Rd
- 6401 Rocky Wagon Ln SW
- 6600 Clara Cir
- 123 Softwind Ln
- 836 Chastain Ave
- 15 Search Dr
- 1320 McAnulty Rd
- 5593 Flowes Store Rd
- 5480 Flowes Store Rd
- 5501 Flowes Store Rd
- 5603 Flowes Store Rd
- 5591 Flowes Store Rd
- 5471 Flowes Store Rd
- 5599 Flowes Store Rd
- 5645 Flowes Store Rd
- 5455 Flowes Store Rd
- 1345 McAnulty Rd
- 5451 Flowes Store Rd
- 5655 Flowes Store Rd
- 1340 McAnulty Rd
- 5660 Flowes Store Rd
- 959 Pointe Andrews Dr Unit .26
- 959 Pointe Andrews Dr
- 5695 Flowes Store Rd
- 963 Pointe Andrews Dr
- 947 Pointe Andrews Dr
Your Personal Tour Guide
Ask me questions while you tour the home.