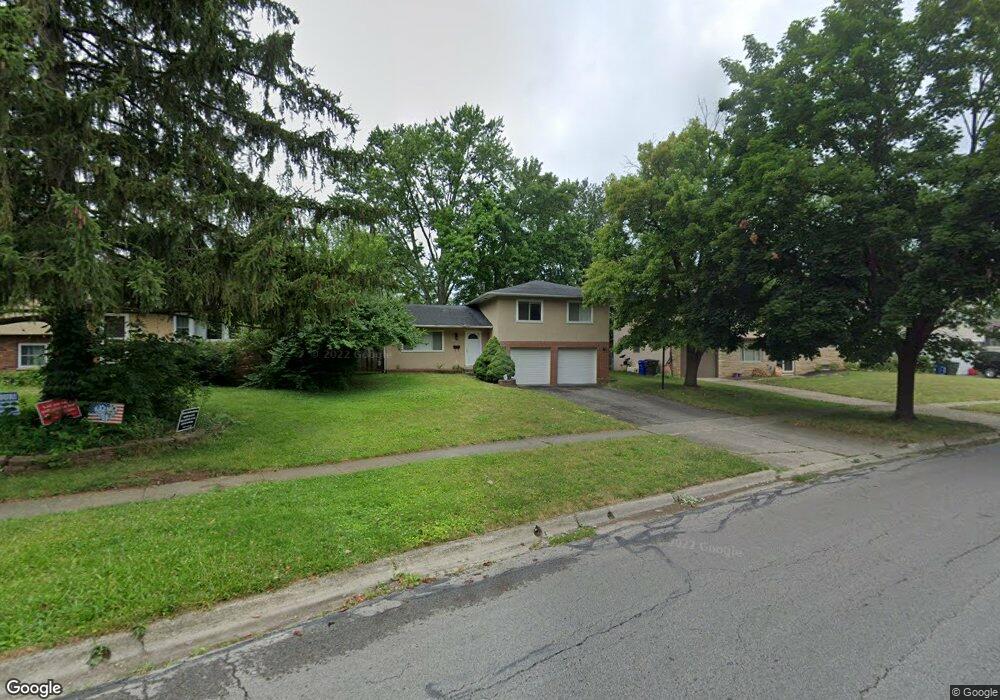
5589 Satinwood Dr Columbus, OH 43229
Forest Park West NeighborhoodEstimated Value: $276,724 - $291,000
3
Beds
2
Baths
1,458
Sq Ft
$195/Sq Ft
Est. Value
About This Home
This home is located at 5589 Satinwood Dr, Columbus, OH 43229 and is currently estimated at $283,931, approximately $194 per square foot. 5589 Satinwood Dr is a home located in Franklin County with nearby schools including Forest Park Elementary School, Woodward Park Middle School, and Northland High School.
Ownership History
Date
Name
Owned For
Owner Type
Purchase Details
Closed on
Apr 14, 2010
Sold by
Jarrell Properties Llc
Bought by
Harvey Mark F
Current Estimated Value
Home Financials for this Owner
Home Financials are based on the most recent Mortgage that was taken out on this home.
Original Mortgage
$121,262
Outstanding Balance
$82,739
Interest Rate
5.5%
Mortgage Type
FHA
Estimated Equity
$201,192
Purchase Details
Closed on
May 24, 2007
Sold by
Conley Erin Renae and Fifth Third Mortgage Co
Bought by
Jarrell Properties Llc
Purchase Details
Closed on
Sep 1, 2005
Sold by
Conley Diane C
Bought by
Conley Kevin
Purchase Details
Closed on
Jul 28, 1995
Sold by
Milliron Larry A
Bought by
Conley Kevin and Conley Diane
Home Financials for this Owner
Home Financials are based on the most recent Mortgage that was taken out on this home.
Original Mortgage
$90,200
Interest Rate
7.59%
Mortgage Type
New Conventional
Purchase Details
Closed on
Apr 2, 1990
Create a Home Valuation Report for This Property
The Home Valuation Report is an in-depth analysis detailing your home's value as well as a comparison with similar homes in the area
Home Values in the Area
Average Home Value in this Area
Purchase History
| Date | Buyer | Sale Price | Title Company |
|---|---|---|---|
| Harvey Mark F | $123,500 | Stewart Tit | |
| Jarrell Properties Llc | $88,000 | Commonwealth Land Title Insu | |
| Conley Kevin | -- | -- | |
| Conley Kevin | $95,000 | -- | |
| -- | $77,300 | -- |
Source: Public Records
Mortgage History
| Date | Status | Borrower | Loan Amount |
|---|---|---|---|
| Open | Harvey Mark F | $121,262 | |
| Previous Owner | Conley Kevin | $90,200 |
Source: Public Records
Tax History Compared to Growth
Tax History
| Year | Tax Paid | Tax Assessment Tax Assessment Total Assessment is a certain percentage of the fair market value that is determined by local assessors to be the total taxable value of land and additions on the property. | Land | Improvement |
|---|---|---|---|---|
| 2024 | $3,552 | $79,140 | $22,190 | $56,950 |
| 2023 | $3,506 | $79,135 | $22,190 | $56,945 |
| 2022 | $2,694 | $51,940 | $12,390 | $39,550 |
| 2021 | $2,699 | $51,940 | $12,390 | $39,550 |
| 2020 | $2,702 | $51,940 | $12,390 | $39,550 |
| 2019 | $2,578 | $42,500 | $9,910 | $32,590 |
| 2018 | $2,377 | $42,500 | $9,910 | $32,590 |
| 2017 | $2,577 | $42,500 | $9,910 | $32,590 |
| 2016 | $2,403 | $36,270 | $9,350 | $26,920 |
| 2015 | $2,181 | $36,270 | $9,350 | $26,920 |
| 2014 | $2,186 | $36,270 | $9,350 | $26,920 |
| 2013 | $1,135 | $38,150 | $9,835 | $28,315 |
Source: Public Records
Map
Nearby Homes
- 5480 Rockwood Ct Unit R1
- 5579 Norcross Rd
- 5415 Vinewood Ct
- 5650 N Meadows Blvd
- 5318 Eisenhower Rd
- 1492 Cottonwood Dr
- 5471 Crawford Dr
- 1390 E Dublin Granville Rd
- 1493 Boxwood Dr
- 964 Strimple Ave
- 5475 Worthington Forest Place E Unit 5475
- 1171 Newbury Dr
- 5231 Arrowood Ct
- 1687 Brookfield Square S
- 1722 Blue Ash Place
- 1385 Thurell Rd
- 1752 Pine Tree St S Unit H
- 5727 Tamarack Blvd Unit A
- 1743 Pine Tree St N Unit A
- 6211 Parkdale Dr
- 5599 Satinwood Dr
- 5571 Rockwood Rd
- 5600 Ironwood Ct
- 5605 Satinwood Dr
- 5561 Rockwood Rd
- 5588 Satinwood Dr
- 5615 Satinwood Dr
- 5600 Satinwood Dr
- 5586 Rockwood Ct
- 5578 Satinwood Dr
- 5628 Ironwood Ct
- 5584 Rockwood Ct
- 5584 Rockwood Ct Unit R-63
- 5626 Ironwood Ct
- 5586 Ironwood Ct
- 5586 Ironwood Ct Unit B
- 5582 Rockwood Ct
- 5582 Rockwood Ct Unit R-62
- 5580 Rockwood Ct Unit R61