
Seller's Agent in 2025
Chris Ohab
COLDWELL BANKER REALTY
(973) 729-6111
1 in this area
93 Total Sales
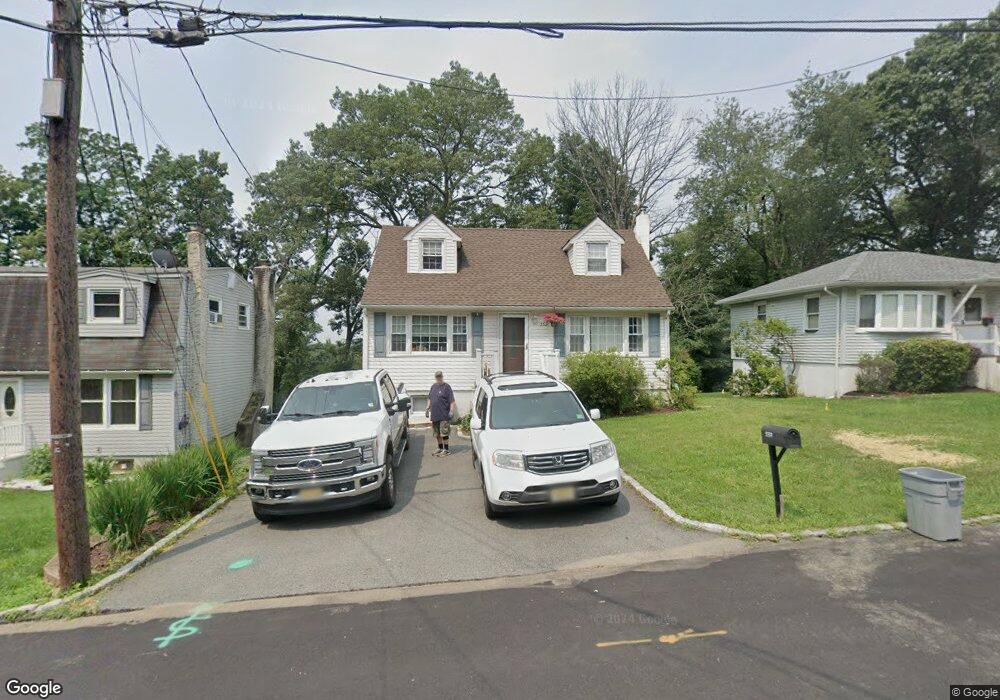
This home is located at 559 Dell Rd, Landing, NJ 07850 and is currently priced at $510,000, approximately $415 per square foot. This property was built in 1950. 559 Dell Rd is a home located in Morris County with nearby schools including Eisenhower Middle School, Lincoln Roosevelt Elementary School, and Roxbury High School.
Last Agent to Sell the Property
COLDWELL BANKER REALTY Brokerage Phone: 973-440-5588 Listed on: 09/08/2025
| Date | Type | Sale Price | Title Company |
|---|---|---|---|
| Interfamily Deed Transfer | -- | None Available | |
| Interfamily Deed Transfer | -- | -- |
| Date | Event | Price | List to Sale | Price per Sq Ft |
|---|---|---|---|---|
| 11/14/2025 11/14/25 | Sold | $510,000 | +7.4% | $415 / Sq Ft |
| 09/29/2025 09/29/25 | Pending | -- | -- | -- |
| 09/14/2025 09/14/25 | For Sale | $475,000 | -- | $387 / Sq Ft |
| Year | Tax Paid | Tax Assessment Tax Assessment Total Assessment is a certain percentage of the fair market value that is determined by local assessors to be the total taxable value of land and additions on the property. | Land | Improvement |
|---|---|---|---|---|
| 2025 | $6,196 | $225,400 | $80,500 | $144,900 |
| 2024 | $6,099 | $225,400 | $80,500 | $144,900 |
| 2023 | $6,099 | $225,400 | $80,500 | $144,900 |
| 2022 | $5,937 | $225,400 | $80,500 | $144,900 |
| 2021 | $5,937 | $225,400 | $80,500 | $144,900 |
| 2020 | $5,926 | $225,400 | $80,500 | $144,900 |
| 2019 | $5,815 | $225,400 | $80,500 | $144,900 |
| 2018 | $5,461 | $126,700 | $49,800 | $76,900 |
| 2017 | $5,432 | $126,700 | $49,800 | $76,900 |
| 2016 | $5,325 | $126,700 | $49,800 | $76,900 |
| 2015 | $5,193 | $126,700 | $49,800 | $76,900 |
| 2014 | $5,111 | $126,700 | $49,800 | $76,900 |
Seller's Agent in 2025
Chris Ohab
COLDWELL BANKER REALTY
(973) 729-6111
1 in this area
93 Total Sales
J
Buyer's Agent in 2025
John Bowe Jr.
WEICHERT RLTRS TEN-CRESKL
(201) 923-8834
1 in this area
36 Total Sales
Source: Garden State MLS
MLS Number: 3985430
APN: 36-12008-0000-00018
Disclaimer: Certain information contained herein is derived from information provided by parties other than Homes.com. All information provided is deemed reliable, but is not guaranteed to be accurate and should be independently verified.
![]() The data relating to real estate for sale on this website comes in part from the IDX Program of Garden State Multiple Listing Service, L.L.C. Real estate listings held by other brokerage firms are marked as IDX Listing.
The data relating to real estate for sale on this website comes in part from the IDX Program of Garden State Multiple Listing Service, L.L.C. Real estate listings held by other brokerage firms are marked as IDX Listing.
Information deemed reliable but not guaranteed.
Copyright © 2025 Garden State Multiple Listing Service, L.L.C. All rights reserved.
Notice: The dissemination of listings on this website does not constitute the consent required by N.J.A.C. 11:5.6.1 (n) for the advertisement of listings exclusively for sale by another broker. Any such consent must be obtained in writing from the listing broker.
This information is being provided for Consumers’ personal, non-commercial use and may not be used for any purpose other than to identify prospective properties Consumers may be interested in purchasing.