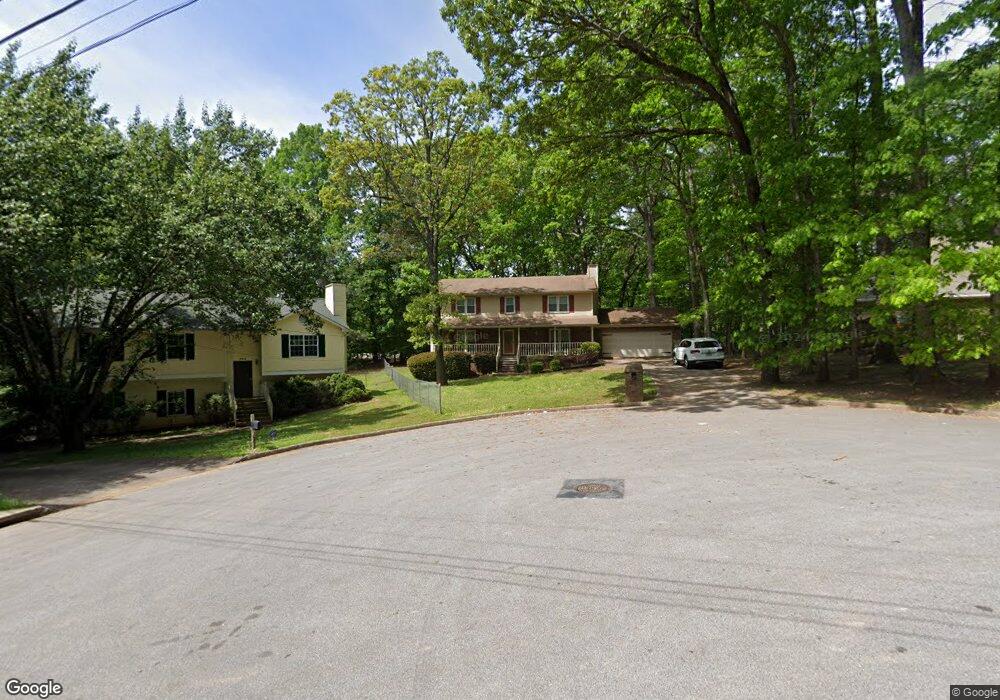
559 Edgefield Dr Unit 3 Stone Mountain, GA 30087
Estimated Value: $270,000 - $348,000
4
Beds
3
Baths
2,195
Sq Ft
$135/Sq Ft
Est. Value
About This Home
This home is located at 559 Edgefield Dr Unit 3, Stone Mountain, GA 30087 and is currently estimated at $295,451, approximately $134 per square foot. 559 Edgefield Dr Unit 3 is a home located in DeKalb County with nearby schools including Pine Ridge Elementary School, Stephenson Middle School, and Stephenson High School.
Ownership History
Date
Name
Owned For
Owner Type
Purchase Details
Closed on
Jun 22, 2009
Sold by
Donovan Shaun
Bought by
Walker Candace
Current Estimated Value
Home Financials for this Owner
Home Financials are based on the most recent Mortgage that was taken out on this home.
Original Mortgage
$86,384
Outstanding Balance
$54,637
Interest Rate
4.79%
Mortgage Type
FHA
Estimated Equity
$240,814
Purchase Details
Closed on
Oct 7, 2008
Sold by
Gmac Mtg Llc
Bought by
Secretary Of Hsng & Urban Dev/
Purchase Details
Closed on
Apr 12, 2000
Sold by
Morin Dominique J and Morin Melinda J
Bought by
Gammon Harvey M
Home Financials for this Owner
Home Financials are based on the most recent Mortgage that was taken out on this home.
Original Mortgage
$139,847
Interest Rate
8.29%
Mortgage Type
FHA
Create a Home Valuation Report for This Property
The Home Valuation Report is an in-depth analysis detailing your home's value as well as a comparison with similar homes in the area
Home Values in the Area
Average Home Value in this Area
Purchase History
| Date | Buyer | Sale Price | Title Company |
|---|---|---|---|
| Walker Candace | -- | -- | |
| Secretary Of Hsng & Urban Dev/ | -- | -- | |
| Gmac Mtg Llc | -- | -- | |
| Gammon Harvey M | $3,000 | -- | |
| Williams Jimmie L | $141,000 | -- |
Source: Public Records
Mortgage History
| Date | Status | Borrower | Loan Amount |
|---|---|---|---|
| Open | Walker Candace | $86,384 | |
| Previous Owner | Williams Jimmie L | $139,847 |
Source: Public Records
Tax History Compared to Growth
Tax History
| Year | Tax Paid | Tax Assessment Tax Assessment Total Assessment is a certain percentage of the fair market value that is determined by local assessors to be the total taxable value of land and additions on the property. | Land | Improvement |
|---|---|---|---|---|
| 2025 | $3,198 | $111,320 | $17,480 | $93,840 |
| 2024 | $3,353 | $114,160 | $17,480 | $96,680 |
| 2023 | $3,353 | $119,440 | $18,000 | $101,440 |
| 2022 | $2,907 | $97,400 | $15,000 | $82,400 |
| 2021 | $2,288 | $70,560 | $10,000 | $60,560 |
| 2020 | $2,091 | $63,040 | $10,000 | $53,040 |
| 2019 | $1,809 | $55,400 | $4,800 | $50,600 |
| 2018 | $1,595 | $49,960 | $4,800 | $45,160 |
| 2017 | $1,493 | $44,720 | $2,880 | $41,840 |
| 2016 | $1,410 | $43,360 | $2,880 | $40,480 |
| 2014 | $1,520 | $46,720 | $2,880 | $43,840 |
Source: Public Records
Map
Nearby Homes
- 505 Stephenson Rd
- 717 Conisburgh Ct
- 470 Stephenson Rd
- 6317 Southland Forest Dr
- 6251 Southland Forest Dr
- 751 Trigg Lake Ct
- 537 Raven Springs Trail
- 504 Raven Springs Trail
- 6518 Gray Hawk Way
- 621 Lakewater View Dr Unit 1
- 636 Raven Springs Trail
- 6744 Rockbridge Rd
- 515 Rock Shadow Ct
- 471 Mount Vista Rd Unit 2
- 648 Bralorne Dr
- 6588 Norcliffe Dr
- 564 Allana Ct
- 676 Bralorne Dr
- 860 Southland Pass
- 725 Navarre Dr
- 563 Edgefield Dr Unit 3
- 6298 Field Mill Rd Unit 3
- 6302 Field Mill Rd Unit 3
- 545 Edgefield Dr Unit 1
- 564 Edgefield Dr Unit 3
- 537 Edgefield Dr Unit 1
- 552 Edgefield Dr
- 6292 Field Mill Rd Unit 2
- 560 Edgefield Dr Unit 3
- 542 Field Glen Ct
- 544 Edgefield Dr
- 6301 Field Mill Rd Unit 3
- 534 Field Glen Ct Unit 1
- 536 Edgefield Dr
- 6309 Field Glen Rd
- 6297 Field Glen Rd
- 529 Edgefield Dr
- 543 Field Glen Ct
- 6297 Field Mill Rd Unit 23
- 6297 Field Mill Rd