559 Hondius Cir Estes Park, CO 80517
Estimated Value: $812,000 - $1,016,000
3
Beds
3
Baths
1,833
Sq Ft
$480/Sq Ft
Est. Value
About This Home
This home is located at 559 Hondius Cir, Estes Park, CO 80517 and is currently estimated at $880,285, approximately $480 per square foot. 559 Hondius Cir is a home located in Larimer County with nearby schools including Estes Park K-5 School, Estes Park Options School, and Estes Park Middle School.
Ownership History
Date
Name
Owned For
Owner Type
Purchase Details
Closed on
Aug 22, 2019
Sold by
Holt Marcia C and Chadwick Bonnie A
Bought by
John S Holt 2013 Trust
Current Estimated Value
Purchase Details
Closed on
Aug 28, 2012
Sold by
Holt John S
Bought by
Jsh Trust #2
Purchase Details
Closed on
May 19, 2011
Sold by
Holt Peter B and Holt Nancy H
Bought by
Holt Peter B and Holt Nancy H
Purchase Details
Closed on
Aug 31, 1994
Sold by
Holt John S
Bought by
Jsh Trust #1
Purchase Details
Closed on
Mar 6, 1984
Sold by
Holt Marcia C
Bought by
Holt John S
Purchase Details
Closed on
Feb 8, 1983
Sold by
Holt Mary B
Bought by
Holt John S and Holt Pater B
Purchase Details
Closed on
Dec 15, 1971
Sold by
Holt M B
Bought by
Holt Mary B
Purchase Details
Closed on
Feb 15, 1969
Sold by
Kimsey H Lawrence
Bought by
Holt Mary B
Purchase Details
Closed on
Sep 4, 1962
Sold by
South Garden Homes Inc
Bought by
Kimsey H Lawrence
Create a Home Valuation Report for This Property
The Home Valuation Report is an in-depth analysis detailing your home's value as well as a comparison with similar homes in the area
Home Values in the Area
Average Home Value in this Area
Purchase History
| Date | Buyer | Sale Price | Title Company |
|---|---|---|---|
| John S Holt 2013 Trust | -- | None Available | |
| Jsh Trust #2 | -- | None Available | |
| Holt Peter B | -- | None Available | |
| Jsh Trust #1 | -- | -- | |
| Holt John S | -- | -- | |
| Holt John S | -- | -- | |
| Holt Mary B | -- | -- | |
| Holt Mary B | $36,000 | -- | |
| Kimsey H Lawrence | $6,000 | -- |
Source: Public Records
Tax History Compared to Growth
Tax History
| Year | Tax Paid | Tax Assessment Tax Assessment Total Assessment is a certain percentage of the fair market value that is determined by local assessors to be the total taxable value of land and additions on the property. | Land | Improvement |
|---|---|---|---|---|
| 2025 | $4,169 | $62,049 | $22,445 | $39,604 |
| 2024 | $4,121 | $62,049 | $22,445 | $39,604 |
| 2022 | $3,187 | $42,749 | $13,900 | $28,849 |
| 2021 | $3,272 | $43,980 | $14,300 | $29,680 |
| 2020 | $3,001 | $39,754 | $14,300 | $25,454 |
| 2019 | $2,979 | $39,754 | $14,300 | $25,454 |
| 2018 | $2,940 | $38,016 | $12,960 | $25,056 |
| 2017 | $2,956 | $38,016 | $12,960 | $25,056 |
| 2016 | $2,430 | $32,365 | $14,328 | $18,037 |
| 2015 | $2,400 | $32,370 | $14,330 | $18,040 |
| 2014 | $1,978 | $27,420 | $14,330 | $13,090 |
Source: Public Records
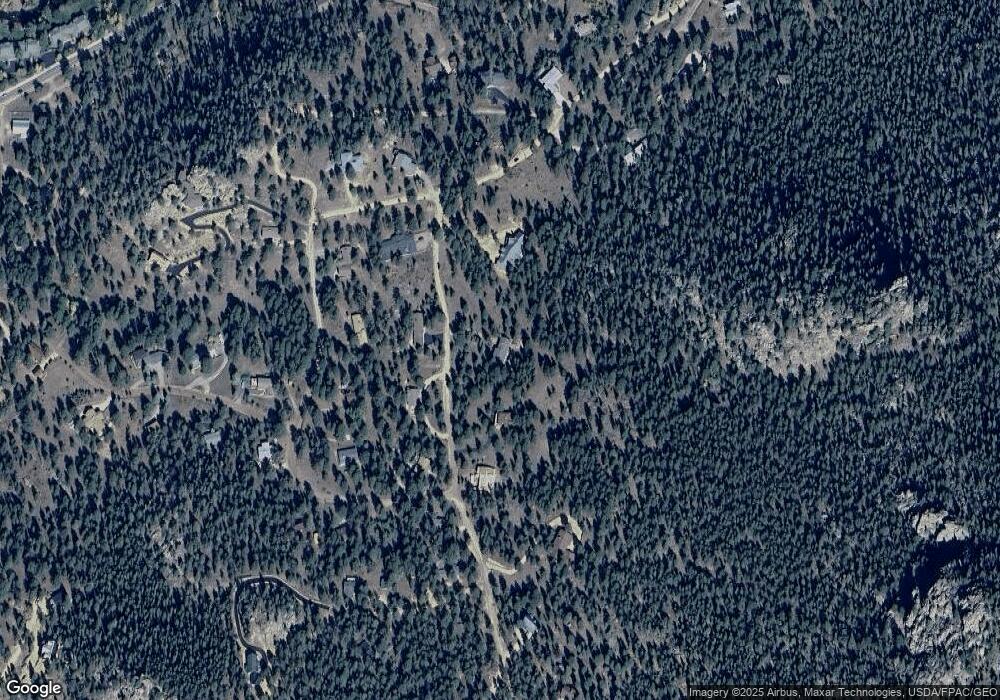
Map
Nearby Homes
- 1111 Prosper Ln
- 467 Riverside Dr
- 647 Park River Place Unit 647
- 620 Park River Place Unit 620
- 6161 36
- 658 Cedar Ridge Cir Unit 1
- 683 Cedar Ridge Cir Unit 2
- 677 Cedar Ridge Cir Unit 5
- 1352 Alpenglow Ln
- 1267 Upper Venner Rd
- 1141 Wallace Ln
- 870 Moraine Ave
- 465 Pine River Ln
- 1550 Prospect Mountain Dr
- 1420 Marys Lake Rd
- 151 Curry Dr
- 0 Alpaca Farm Way
- 197 Curry Dr
- 1263 Broadview
- 303 Curry Dr
- 565 Hondius Cir
- 547 Hondius Cir
- 560 Hondius Cir
- 571 Hondius Cir
- 570 Hondius Cir
- 540 Hondius Cir
- 9999 Hondius Ct
- 520 Hondius Cir
- 510 Hondius Cir
- 590 Hondius Cir
- 1110 Hondius Ln
- 577 Hondius Cir
- 543 Hondius Cir
- 541 Hondius Cir
- 583 Hondius Cir
- 1111 Hondius Ln
- 900 Turquoise Trail
- 1030 Prospect Park Dr
- 535 Hondius Cir
- 595 Hondius Cir