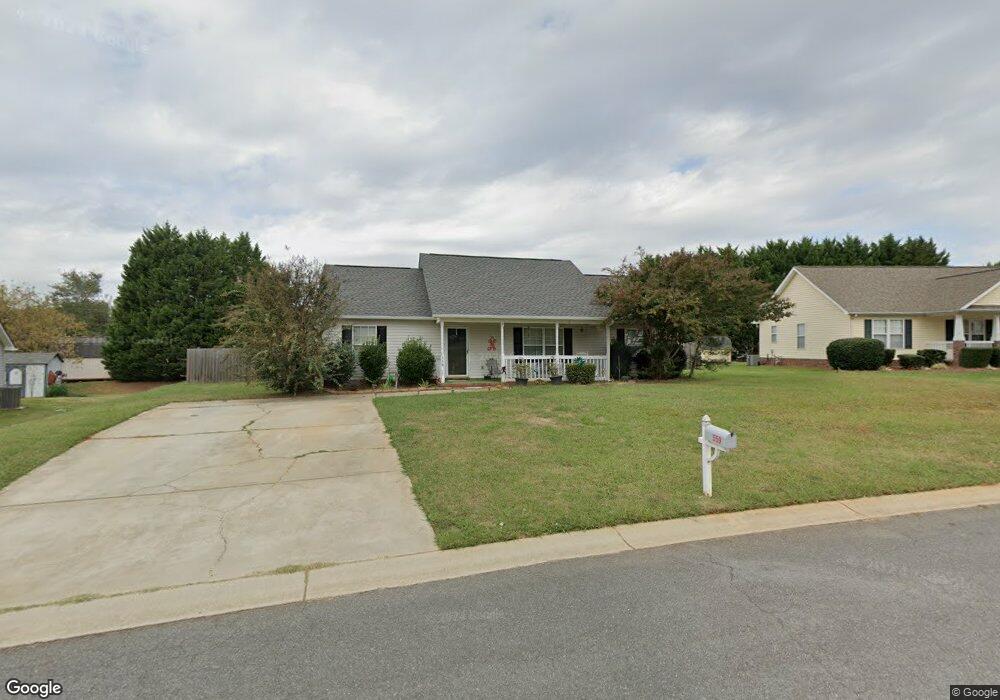
559 Jedburgh Way Rock Hill, SC 29730
Estimated Value: $298,657 - $316,000
3
Beds
2
Baths
1,420
Sq Ft
$217/Sq Ft
Est. Value
About This Home
This home is located at 559 Jedburgh Way, Rock Hill, SC 29730 and is currently estimated at $307,914, approximately $216 per square foot. 559 Jedburgh Way is a home located in York County with nearby schools including Saluda Trail Middle School, South Pointe High School, and Providence Classical School.
Ownership History
Date
Name
Owned For
Owner Type
Purchase Details
Closed on
Jan 28, 2016
Sold by
Cannon Joshua R and Cannon Emily R
Bought by
Nordin Kimberly A
Current Estimated Value
Home Financials for this Owner
Home Financials are based on the most recent Mortgage that was taken out on this home.
Original Mortgage
$140,900
Outstanding Balance
$112,650
Interest Rate
4.04%
Mortgage Type
FHA
Estimated Equity
$195,264
Purchase Details
Closed on
Dec 5, 2013
Sold by
Young Edwin G
Bought by
Cannon Joshua R and Cannon Emily R
Home Financials for this Owner
Home Financials are based on the most recent Mortgage that was taken out on this home.
Original Mortgage
$103,900
Interest Rate
4%
Mortgage Type
New Conventional
Purchase Details
Closed on
Jun 24, 2013
Sold by
Dunlap David M and Dunlap Tonya F
Bought by
Young Edwin G
Purchase Details
Closed on
Apr 30, 2003
Sold by
Carroll Christine B
Bought by
Dunlap David M and Dunlap Tonya F
Purchase Details
Closed on
Jan 23, 2002
Sold by
Piedmont Partners
Bought by
Carroll Christine B
Create a Home Valuation Report for This Property
The Home Valuation Report is an in-depth analysis detailing your home's value as well as a comparison with similar homes in the area
Home Values in the Area
Average Home Value in this Area
Purchase History
| Date | Buyer | Sale Price | Title Company |
|---|---|---|---|
| Nordin Kimberly A | $143,500 | -- | |
| Cannon Joshua R | $107,900 | -- | |
| Young Edwin G | $79,500 | -- | |
| Dunlap David M | $104,500 | -- | |
| Carroll Christine B | $23,500 | -- |
Source: Public Records
Mortgage History
| Date | Status | Borrower | Loan Amount |
|---|---|---|---|
| Open | Nordin Kimberly A | $140,900 | |
| Previous Owner | Cannon Joshua R | $103,900 |
Source: Public Records
Tax History Compared to Growth
Tax History
| Year | Tax Paid | Tax Assessment Tax Assessment Total Assessment is a certain percentage of the fair market value that is determined by local assessors to be the total taxable value of land and additions on the property. | Land | Improvement |
|---|---|---|---|---|
| 2024 | $1,300 | $5,923 | $1,520 | $4,403 |
| 2023 | $1,303 | $5,923 | $1,520 | $4,403 |
| 2022 | $1,312 | $5,923 | $1,520 | $4,403 |
| 2021 | -- | $5,923 | $1,520 | $4,403 |
| 2020 | $1,315 | $5,923 | $0 | $0 |
| 2019 | $1,246 | $5,440 | $0 | $0 |
| 2018 | $1,244 | $5,440 | $0 | $0 |
| 2017 | $3,294 | $8,160 | $0 | $0 |
| 2016 | $939 | $8,160 | $0 | $0 |
| 2014 | $1,007 | $4,300 | $1,200 | $3,100 |
| 2013 | $1,007 | $6,450 | $1,800 | $4,650 |
Source: Public Records
Map
Nearby Homes
- 564 Menzies Dr
- 823 Prestwick Dr
- 532 Jedburgh Way
- 309 Haddington Ct
- 116 Scottie Ct
- 1257 Reese Roach Rd
- 861 Carey Dr
- 1191 Westover Cir
- 842 S Cherry Rd
- 836 S Cherry Rd
- 851 Gist Rd
- 1024 Westover Cir
- 1116 Westover Cir
- 1195 Cavalier Ln
- 1650 W Main St
- 536 Glenn St
- 1391 Colwick Ln
- 1540 Coatsworth Ln
- 1609 Begonia Way
- 1625 Begonia Way
- 559 Jedburgh Way Unit 121
- 563 Jedburgh Way
- 551 Jedburgh Way
- 558 Strathclyde Way
- 554 Strathclyde Way
- 567 Jedburgh Way
- 548 Jedburgh Way
- 562 Strathclyde Way
- 546 Strathclyde Way
- 543 Jedburgh Way
- 566 Strathclyde Way
- 544 Jedburgh Way
- 556 Jedburgh Way
- 542 Strathclyde Way
- 571 Jedburgh Way
- 539 Jedburgh Way Unit 118
- 539 Jedburgh Way
- 561 Strathclyde Way
- 540 Jedburgh Way
- 557 Strathclyde Way