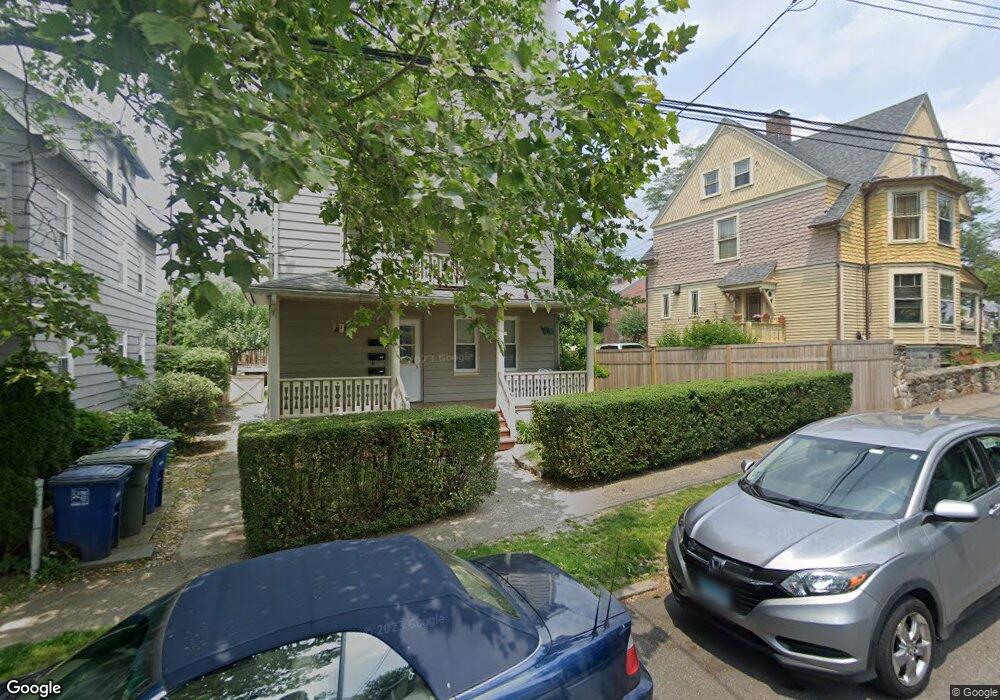
559 Midland St Unit 563 Bridgeport, CT 06605
Black Rock NeighborhoodEstimated Value: $349,719 - $771,000
6
Beds
3
Baths
2,290
Sq Ft
$223/Sq Ft
Est. Value
About This Home
This home is located at 559 Midland St Unit 563, Bridgeport, CT 06605 and is currently estimated at $510,680, approximately $223 per square foot. 559 Midland St Unit 563 is a home located in Fairfield County with nearby schools including Black Rock School, Bassick High School, and Park City Prep Charter School.
Ownership History
Date
Name
Owned For
Owner Type
Purchase Details
Closed on
Aug 4, 2015
Sold by
-Stevens David
Bought by
Stevens Sonia
Current Estimated Value
Purchase Details
Closed on
Feb 21, 2002
Sold by
Shawah George M and Sam John W
Bought by
Stevens David J and Stevens Sonia
Home Financials for this Owner
Home Financials are based on the most recent Mortgage that was taken out on this home.
Original Mortgage
$132,000
Interest Rate
7.38%
Purchase Details
Closed on
Dec 5, 1989
Sold by
Formato Joseph
Bought by
Shawah George
Create a Home Valuation Report for This Property
The Home Valuation Report is an in-depth analysis detailing your home's value as well as a comparison with similar homes in the area
Home Values in the Area
Average Home Value in this Area
Purchase History
| Date | Buyer | Sale Price | Title Company |
|---|---|---|---|
| Stevens Sonia | -- | -- | |
| Stevens Sonia | -- | -- | |
| Stevens David J | $165,000 | -- | |
| Stevens David J | $165,000 | -- | |
| Shawah George | $145,000 | -- |
Source: Public Records
Mortgage History
| Date | Status | Borrower | Loan Amount |
|---|---|---|---|
| Previous Owner | Shawah George | $277,000 | |
| Previous Owner | Shawah George | $132,000 |
Source: Public Records
Tax History Compared to Growth
Tax History
| Year | Tax Paid | Tax Assessment Tax Assessment Total Assessment is a certain percentage of the fair market value that is determined by local assessors to be the total taxable value of land and additions on the property. | Land | Improvement |
|---|---|---|---|---|
| 2025 | $10,442 | $240,330 | $135,670 | $104,660 |
| 2024 | $10,442 | $240,330 | $135,670 | $104,660 |
| 2023 | $10,442 | $240,330 | $135,670 | $104,660 |
| 2022 | $10,442 | $240,330 | $135,670 | $104,660 |
| 2021 | $10,442 | $240,330 | $135,670 | $104,660 |
| 2020 | $9,044 | $167,520 | $80,540 | $86,980 |
| 2019 | $9,044 | $167,520 | $80,540 | $86,980 |
| 2018 | $9,108 | $167,520 | $80,540 | $86,980 |
| 2017 | $9,108 | $167,520 | $80,540 | $86,980 |
| 2016 | $9,108 | $167,520 | $80,540 | $86,980 |
| 2015 | $8,485 | $201,060 | $76,710 | $124,350 |
| 2014 | -- | $201,060 | $76,710 | $124,350 |
Source: Public Records
Map
Nearby Homes
- 39 Jetland Place Unit 41
- 75 Homestead Ave Unit 77
- 554 Brewster St Unit 4
- 317 Brewster St
- 20 Haddon St Unit 5
- 26 Rowsley St Unit 3
- 37 Rowsley St Unit 6
- 105 Fox St Unit 107
- 165 Bennett St
- 51 Princeton St
- 166 Alfred St
- 855 Brewster St Unit 857
- 167 Scofield Ave
- 82 Waldorf Ave
- 361 Riverside Dr
- 135 Whittier St
- 25 Whittier St
- 31 Whittier St
- 0 Battery Park Dr
- 2180 Kings Hwy Unit 1
- 551 Midland St Unit 555
- 11 Jetland St
- 545 Midland St
- 541 Midland St Unit 545
- 37 Jetland St Unit 41
- 37-41 Jetland St
- 537 Midland St Unit 3
- 537 Midland St
- 43 Jetland St Unit 47
- 33 Hanford Ave Unit 35
- 566 Midland St
- 564 Midland St Unit 566
- 564 Midland St Unit 2ND F
- 564 Midland St Unit 1ST
- 21 Hanford Ave
- 23 Hanford Ave
- 556 Midland St Unit 558
- 35 Hanford Ave
- 546 Midland St Unit 550
- 546 Midland St Unit 2