
Landlord's Agent in 2025
CJ Wilson
ATL Rental Management, LLC
(678) 431-3836
12 in this area
59 Total Sales
Estimated Value: $441,164 - $549,000
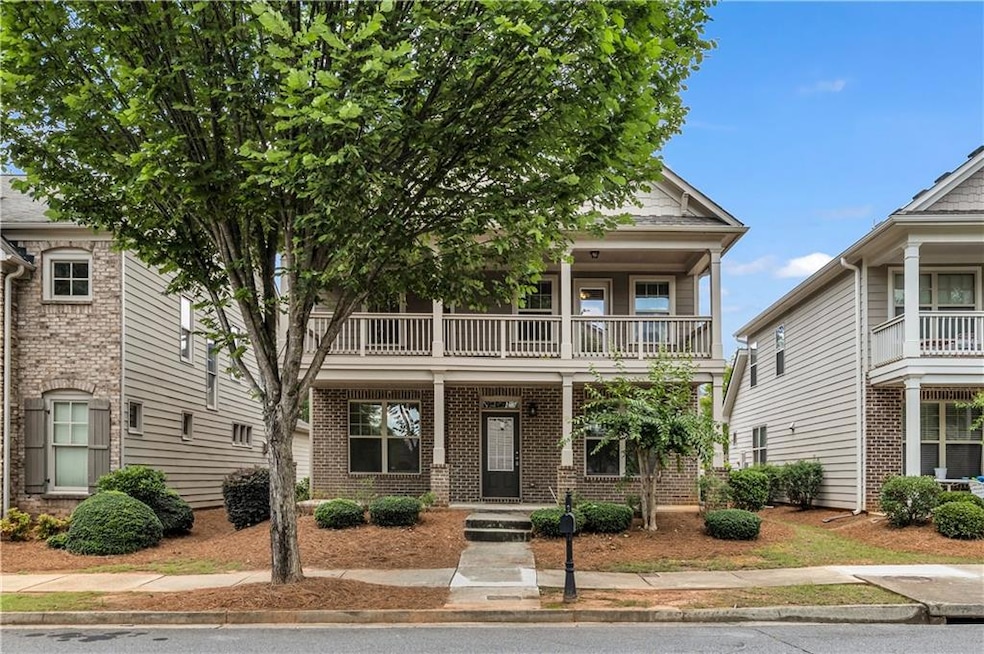
North Gwinnett Cluster Craftsman home features rear-entry plan and boasts gracious front porch entry. Gleaming hardwoods throughout formal dining, family room and eat-in kitchen. S/S Whirlpool appliances set off beautiful open kitchen w generous bar for extra seating. Private study on main could be 4th bedroom. Up the wrapped staircase are 2 large secondary bedrooms and amazing master suite w huge closet and trey ceilings spans entire front of home. Lots of windows and a door to owner's private balcony. Close to Lawrenceville Suwanee road, restaurants and shopping. Community has pool access and min to Suwanee Town Center. Community has no rental cap. Great investment opportunity.
| Date | Buyer | Sale Price | Title Company |
|---|---|---|---|
| Shi Xiaohong | -- | -- | |
| Jams Llc | $250,000 | -- | |
| Shi Xiaohong | $224,000 | -- | |
| John Thomas Partners Llc | $114,000 | -- |
| Date | Status | Borrower | Loan Amount |
|---|---|---|---|
| Previous Owner | Shi Xiaohong | $168,000 |
| Date | Event | Price | List to Sale | Price per Sq Ft | Prior Sale |
|---|---|---|---|---|---|
| 09/10/2025 09/10/25 | Rented | $2,549 | 0.0% | -- | |
| 09/10/2025 09/10/25 | Under Contract | -- | -- | -- | |
| 08/24/2025 08/24/25 | Price Changed | $2,549 | -1.9% | $1 / Sq Ft | |
| 07/14/2025 07/14/25 | For Rent | $2,599 | +6.1% | -- | |
| 07/01/2024 07/01/24 | Rented | $2,450 | 0.0% | -- | |
| 06/15/2024 06/15/24 | Under Contract | -- | -- | -- | |
| 05/20/2024 05/20/24 | For Rent | $2,450 | +2.1% | -- | |
| 04/30/2023 04/30/23 | Rented | $2,400 | 0.0% | -- | |
| 04/12/2023 04/12/23 | Under Contract | -- | -- | -- | |
| 03/06/2023 03/06/23 | For Rent | $2,400 | +24.7% | -- | |
| 04/16/2021 04/16/21 | Rented | $1,925 | 0.0% | -- | |
| 04/13/2021 04/13/21 | Under Contract | -- | -- | -- | |
| 04/09/2021 04/09/21 | For Rent | $1,925 | +20.3% | -- | |
| 11/20/2014 11/20/14 | Rented | $1,600 | -99.3% | -- | |
| 10/21/2014 10/21/14 | Under Contract | -- | -- | -- | |
| 09/24/2014 09/24/14 | Sold | $224,000 | 0.0% | $122 / Sq Ft | View Prior Sale |
| 09/24/2014 09/24/14 | For Rent | $1,600 | 0.0% | -- | |
| 08/25/2014 08/25/14 | Pending | -- | -- | -- | |
| 06/08/2014 06/08/14 | For Sale | $226,180 | -- | $123 / Sq Ft |
| Year | Tax Paid | Tax Assessment Tax Assessment Total Assessment is a certain percentage of the fair market value that is determined by local assessors to be the total taxable value of land and additions on the property. | Land | Improvement |
|---|---|---|---|---|
| 2025 | $6,037 | $191,040 | $38,000 | $153,040 |
| 2024 | $4,733 | $147,920 | $31,200 | $116,720 |
| 2023 | $4,733 | $147,920 | $31,200 | $116,720 |
| 2022 | $5,566 | $147,920 | $31,200 | $116,720 |
| 2021 | $4,395 | $116,480 | $24,400 | $92,080 |
| 2020 | $4,424 | $116,480 | $24,400 | $92,080 |
| 2019 | $3,839 | $116,480 | $24,400 | $92,080 |
| 2018 | $3,408 | $102,920 | $22,280 | $80,640 |
| 2016 | $3,065 | $92,680 | $24,400 | $68,280 |
| 2015 | $2,824 | $84,240 | $21,600 | $62,640 |
| 2014 | -- | $15,200 | $15,200 | $0 |
Landlord's Agent in 2025
CJ Wilson
ATL Rental Management, LLC
(678) 431-3836
12 in this area
59 Total Sales
Tenant's Agent in 2025
Sang Seol
National Representative Realty, LLC
(770) 568-3495
1 in this area
8 Total Sales
Seller's Agent in 2021
David Dutton
EXP Realty, LLC.
(770) 596-0713
6 in this area
104 Total Sales
Buyer's Agent in 2021
Eddrica Joffrion
Keller Williams Realty Atlanta Partners
(470) 563-5530
16 Total Sales
C
Seller's Agent in 2014
Curtis Walker
NOT A VALID MEMBER
A
Seller Co-Listing Agent in 2014
Ashley Dutton
Keller Williams Chattahoochee
(678) 234-3581
1 Total Sale
Source: First Multiple Listing Service (FMLS)
MLS Number: 7614766
APN: 7-193-576
![]() Listings identified with the FMLS IDX logo come from FMLS and are held by brokerage firms other than the owner of this website. The listing brokerage is identified in any listing details. Information is deemed reliable but is not guaranteed. If you believe any FMLS listing contains material that infringes your copyrighted work please visit www.fmls.com/dmca to review our DMCA policy and learn how to submit a takedown request. © 2025 First Multiple Listing Service, Inc.
Listings identified with the FMLS IDX logo come from FMLS and are held by brokerage firms other than the owner of this website. The listing brokerage is identified in any listing details. Information is deemed reliable but is not guaranteed. If you believe any FMLS listing contains material that infringes your copyrighted work please visit www.fmls.com/dmca to review our DMCA policy and learn how to submit a takedown request. © 2025 First Multiple Listing Service, Inc.
Disclaimer: Certain information contained herein is derived from information provided by parties other than Homes.com. All information provided is deemed reliable, but is not guaranteed to be accurate and should be independently verified.