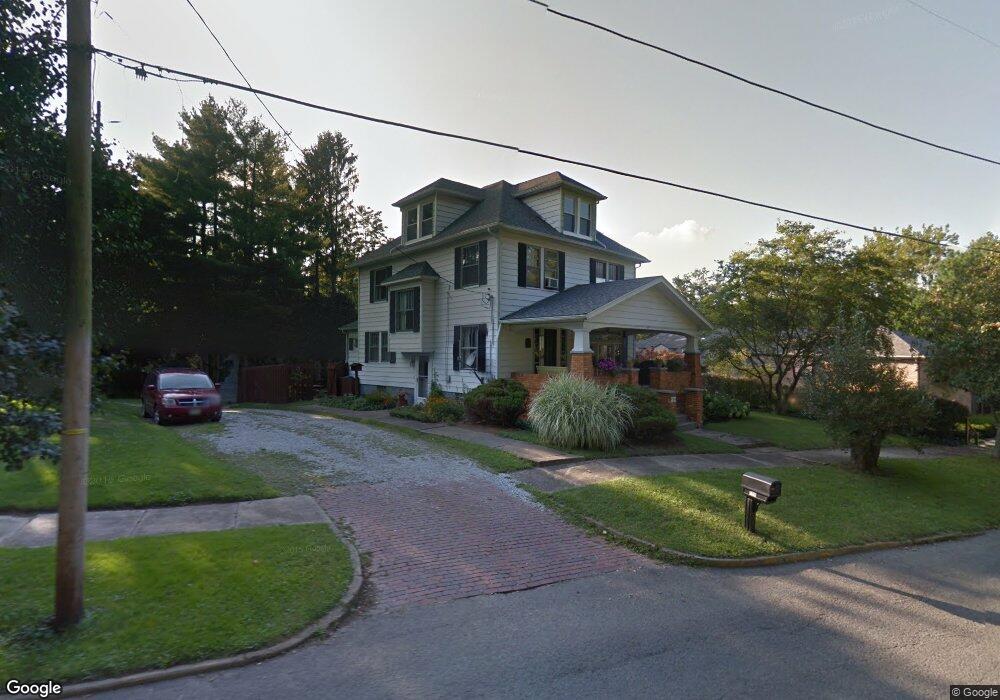
559 N Main St Magnolia, OH 44643
Estimated Value: $212,000 - $292,000
4
Beds
3
Baths
1,840
Sq Ft
$133/Sq Ft
Est. Value
About This Home
This home is located at 559 N Main St, Magnolia, OH 44643 and is currently estimated at $244,308, approximately $132 per square foot. 559 N Main St is a home located in Stark County with nearby schools including Sandy Valley Elementary School, Sandy Valley Middle School, and Sandy Valley High School.
Ownership History
Date
Name
Owned For
Owner Type
Purchase Details
Closed on
Aug 22, 2014
Sold by
Merrill Maureen G
Bought by
Downes Grant E and Downes Sarah D
Current Estimated Value
Home Financials for this Owner
Home Financials are based on the most recent Mortgage that was taken out on this home.
Original Mortgage
$106,400
Outstanding Balance
$81,221
Interest Rate
4.14%
Mortgage Type
New Conventional
Estimated Equity
$163,087
Purchase Details
Closed on
Jul 21, 2001
Sold by
Merrill James J
Bought by
Merrill Maureen G
Create a Home Valuation Report for This Property
The Home Valuation Report is an in-depth analysis detailing your home's value as well as a comparison with similar homes in the area
Home Values in the Area
Average Home Value in this Area
Purchase History
| Date | Buyer | Sale Price | Title Company |
|---|---|---|---|
| Downes Grant E | $133,000 | None Available | |
| Merrill Maureen G | -- | -- |
Source: Public Records
Mortgage History
| Date | Status | Borrower | Loan Amount |
|---|---|---|---|
| Open | Downes Grant E | $106,400 |
Source: Public Records
Tax History Compared to Growth
Tax History
| Year | Tax Paid | Tax Assessment Tax Assessment Total Assessment is a certain percentage of the fair market value that is determined by local assessors to be the total taxable value of land and additions on the property. | Land | Improvement |
|---|---|---|---|---|
| 2025 | -- | $55,130 | $19,710 | $35,420 |
| 2024 | -- | $55,130 | $19,710 | $35,420 |
| 2023 | $2,067 | $42,150 | $12,290 | $29,860 |
| 2022 | $1,041 | $42,150 | $12,290 | $29,860 |
| 2021 | $2,097 | $42,150 | $12,290 | $29,860 |
| 2020 | $1,920 | $37,390 | $10,610 | $26,780 |
| 2019 | $2,026 | $37,390 | $10,610 | $26,780 |
| 2018 | $2,054 | $37,390 | $10,610 | $26,780 |
| 2017 | $1,992 | $34,270 | $10,150 | $24,120 |
| 2016 | $1,670 | $28,350 | $10,150 | $18,200 |
| 2015 | $1,717 | $28,980 | $10,150 | $18,830 |
| 2014 | $1,396 | $22,750 | $7,980 | $14,770 |
| 2013 | $127 | $22,340 | $7,980 | $14,360 |
Source: Public Records
Map
Nearby Homes
- 217 E Carrollton St
- 614 Levee Cir
- 715 Minerva Rd
- 1.06 Ac Vacant Lot N Lynnwood Dr
- 1.25 Ac Vacant Lot N Lynnwood Dr
- 3750 Farber St SE
- 3799 Westbrook St SE
- 5488 Elson St SE
- 0 W Lisbon St
- 156 W Lisbon St
- 0 Goodland St SE
- 7796 Mottice Dr SE
- 0 Elson St SE Unit 5130913
- 5236 Hilltop Dr NE
- 10440 Circle Dr SE
- 0 Lampe Lane North E Unit 5162024
- 5416 M Ave
- 2251 Farber St
- 8522 Cleveland Ave SE
- 7803 Elson St SE