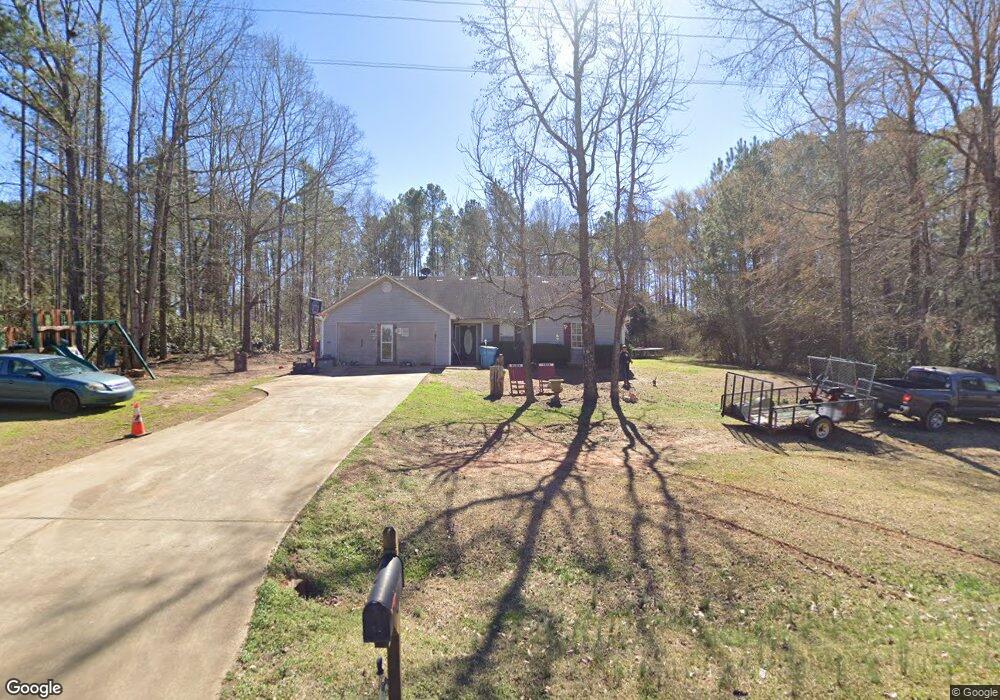
559 Rocky Point Rd Covington, GA 30014
Estimated Value: $308,081 - $378,000
Studio
2
Baths
1,879
Sq Ft
$178/Sq Ft
Est. Value
About This Home
This home is located at 559 Rocky Point Rd, Covington, GA 30014 and is currently estimated at $334,770, approximately $178 per square foot. 559 Rocky Point Rd is a home located in Newton County with nearby schools including Rocky Plains Elementary School, Indian Creek Middle School, and Alcovy High School.
Ownership History
Date
Name
Owned For
Owner Type
Purchase Details
Closed on
Jul 23, 2007
Sold by
Jp Morgan Chase Bk
Bought by
Allen Tony
Current Estimated Value
Purchase Details
Closed on
May 1, 2007
Sold by
Burns Ronald C
Bought by
Jp Morgan Chase Bk
Purchase Details
Closed on
May 11, 2001
Sold by
Cline Michelle D
Bought by
Burns Ronald C
Home Financials for this Owner
Home Financials are based on the most recent Mortgage that was taken out on this home.
Original Mortgage
$92,000
Interest Rate
6.98%
Mortgage Type
New Conventional
Purchase Details
Closed on
Jun 29, 2000
Sold by
Apache Homes Inc
Bought by
Burns Ronald C
Home Financials for this Owner
Home Financials are based on the most recent Mortgage that was taken out on this home.
Original Mortgage
$88,175
Interest Rate
8.54%
Mortgage Type
FHA
Create a Home Valuation Report for This Property
The Home Valuation Report is an in-depth analysis detailing your home's value as well as a comparison with similar homes in the area
Home Values in the Area
Average Home Value in this Area
Purchase History
| Date | Buyer | Sale Price | Title Company |
|---|---|---|---|
| Allen Tony | $90,000 | -- | |
| Jp Morgan Chase Bk | $122,162 | -- | |
| Burns Ronald C | $2,500 | -- | |
| Burns Ronald C | $88,900 | -- |
Source: Public Records
Mortgage History
| Date | Status | Borrower | Loan Amount |
|---|---|---|---|
| Previous Owner | Burns Ronald C | $92,000 | |
| Previous Owner | Burns Ronald C | $88,175 |
Source: Public Records
Tax History
| Year | Tax Paid | Tax Assessment Tax Assessment Total Assessment is a certain percentage of the fair market value that is determined by local assessors to be the total taxable value of land and additions on the property. | Land | Improvement |
|---|---|---|---|---|
| 2025 | $2,604 | $128,040 | $14,800 | $113,240 |
| 2024 | $2,439 | $115,600 | $12,800 | $102,800 |
| 2023 | $2,376 | $106,920 | $9,000 | $97,920 |
| 2022 | $1,622 | $79,120 | $7,200 | $71,920 |
| 2021 | $1,501 | $68,920 | $7,200 | $61,720 |
| 2020 | $1,391 | $60,880 | $7,200 | $53,680 |
| 2019 | $921 | $46,480 | $5,600 | $40,880 |
| 2018 | $1,396 | $44,560 | $5,600 | $38,960 |
| 2017 | $1,117 | $36,440 | $4,000 | $32,440 |
| 2016 | $891 | $29,840 | $3,200 | $26,640 |
| 2015 | $902 | $30,160 | $3,200 | $26,960 |
| 2014 | $795 | $27,080 | $0 | $0 |
Source: Public Records
Map
Nearby Homes
- 390 Rocky Point Rd
- 0000 Rocky Point Rd
- 0 Rocky Point Rd Unit 10693424
- 800 Rocky Point Rd
- 225 Lang Cir
- 480 Friar Tuck Cir
- 755 Lang Cir
- 230 Friar Tuck Cir
- 480 Mitchell Rd
- 500 Lang Rd
- 211 Mitchell Rd
- 458 Haley Rd
- 470 Haley Rd
- 0 Malcom Rd Unit 10594529
- 473 Haley Rd
- 296 Reeves Rd
- 184 Bradley Rd
- 162 Collins Rd
- 386 Parker Rd
- 265 Thorpe Rd
- 571 Rocky Point Rd
- 535 Rocky Point Rd
- 583 Rocky Point Rd
- 5 Lang Rd
- 0 Lang Rd Unit 7184355
- 0 Lang Rd Unit 4011343
- 0 Lang Rd Unit 5220002
- 0 Lang Rd Unit 8855710
- 0 Lang Rd Unit 6778403
- 0 Lang Rd Unit 8719039
- 0 Lang Rd Unit 6666599
- 0 Lang Rd Unit 86 8623275
- 0 Lang Rd Unit 6586404
- 0 Lang Rd Unit 86 8481308
- 15 Lang Rd
- 725 Lazy Ln
- 25 Lang Rd
- 8 Lang Rd
- 45 Lang Rd
- 1035 Lazy Ln
Your Personal Tour Guide
Ask me questions while you tour the home.