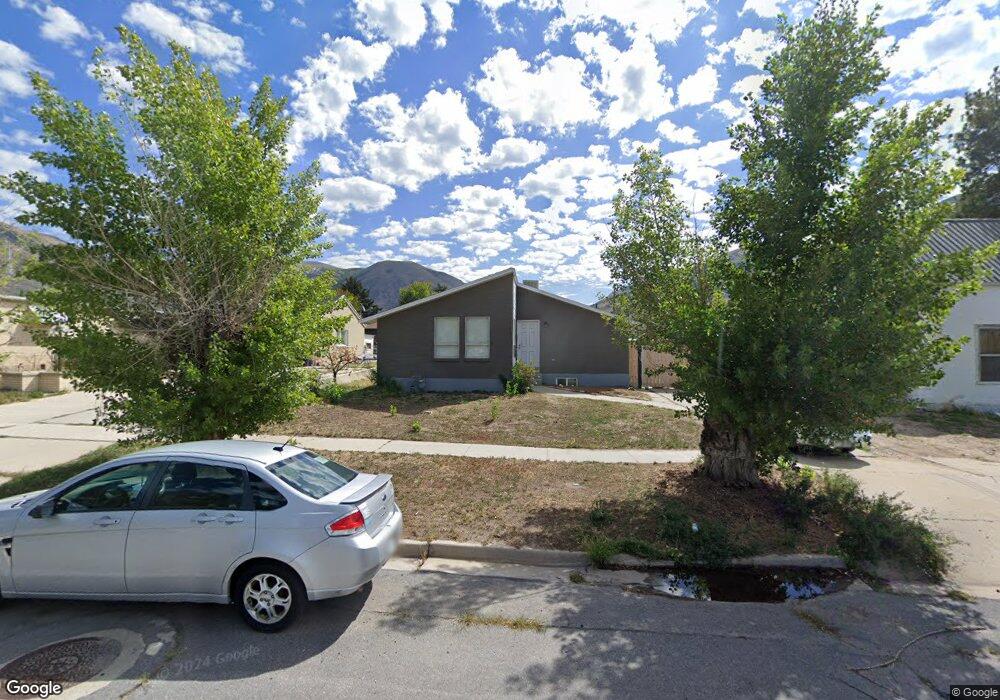
559 S 100 E Brigham City, UT 84302
Estimated Value: $357,000 - $386,163
5
Beds
2
Baths
2,040
Sq Ft
$184/Sq Ft
Est. Value
About This Home
This home is located at 559 S 100 E, Brigham City, UT 84302 and is currently estimated at $374,541, approximately $183 per square foot. 559 S 100 E is a home located in Box Elder County with nearby schools including Golden Spike Elementary, Adele C. Young Intermediate School, and Box Elder Middle School.
Ownership History
Date
Name
Owned For
Owner Type
Purchase Details
Closed on
Oct 22, 2020
Sold by
Sargent Caleb M
Bought by
Sargent Caleb M and Sargent Sarah K
Current Estimated Value
Home Financials for this Owner
Home Financials are based on the most recent Mortgage that was taken out on this home.
Original Mortgage
$271,000
Outstanding Balance
$238,384
Interest Rate
2.8%
Mortgage Type
FHA
Estimated Equity
$136,157
Purchase Details
Closed on
Mar 27, 2020
Sold by
Secretary Of Housing & Urban Deveopment
Bought by
Shamen Properties Llc
Home Financials for this Owner
Home Financials are based on the most recent Mortgage that was taken out on this home.
Original Mortgage
$216,000
Interest Rate
3.4%
Mortgage Type
Seller Take Back
Purchase Details
Closed on
May 14, 2019
Sold by
Wells Fargo Bank Na
Bought by
Secretary Of Housing And Urban Dev
Create a Home Valuation Report for This Property
The Home Valuation Report is an in-depth analysis detailing your home's value as well as a comparison with similar homes in the area
Purchase History
| Date | Buyer | Sale Price | Title Company |
|---|---|---|---|
| Sargent Caleb M | -- | Accommodation | |
| Sargent Caleb M | -- | Gt Title Svcs Spanish Fork | |
| Shamen Properties Llc | -- | Accommodation | |
| Secretary Of Housing And Urban Dev | -- | Boston National Ttl Agcy Llc |
Source: Public Records
Mortgage History
| Date | Status | Borrower | Loan Amount |
|---|---|---|---|
| Open | Sargent Caleb M | $271,000 | |
| Previous Owner | Shamen Properties Llc | $216,000 |
Source: Public Records
Tax History
| Year | Tax Paid | Tax Assessment Tax Assessment Total Assessment is a certain percentage of the fair market value that is determined by local assessors to be the total taxable value of land and additions on the property. | Land | Improvement |
|---|---|---|---|---|
| 2025 | $1,862 | $320,239 | $105,000 | $215,239 |
| 2024 | $1,626 | $313,084 | $100,000 | $213,084 |
| 2023 | $1,671 | $329,314 | $95,000 | $234,314 |
| 2022 | $1,647 | $166,021 | $22,000 | $144,021 |
| 2021 | $1,373 | $209,026 | $40,000 | $169,026 |
| 2020 | $1,287 | $209,026 | $40,000 | $169,026 |
| 2019 | $1,206 | $104,270 | $22,000 | $82,270 |
| 2018 | $1,088 | $93,539 | $22,000 | $71,539 |
| 2017 | $971 | $144,434 | $16,500 | $114,434 |
| 2016 | $1,016 | $76,442 | $16,500 | $59,942 |
| 2015 | $944 | $70,992 | $16,500 | $54,492 |
| 2014 | $944 | $68,397 | $16,500 | $51,897 |
| 2013 | -- | $68,397 | $16,500 | $51,897 |
Source: Public Records
Map
Nearby Homes
Your Personal Tour Guide
Ask me questions while you tour the home.