Estimated Value: $248,000 - $270,122
3
Beds
2
Baths
1,690
Sq Ft
$156/Sq Ft
Est. Value
About This Home
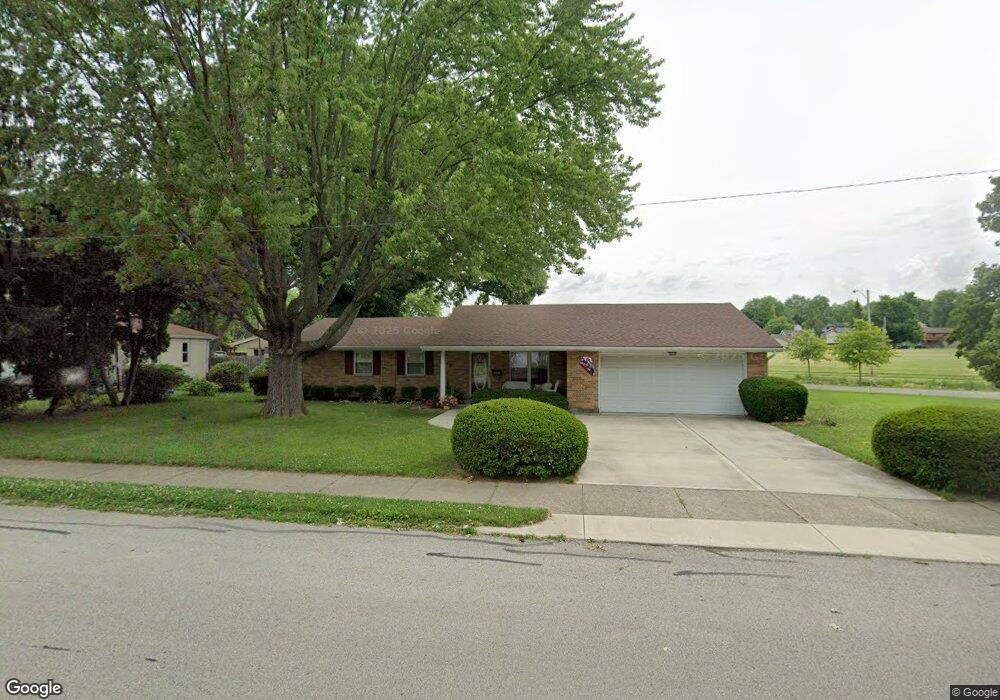
This home is located at 559 Sutton Dr, Xenia, OH 45385 and is currently estimated at $263,781, approximately $156 per square foot. 559 Sutton Dr is a home located in Greene County with nearby schools including Xenia High School, Summit Academy Community School for Alternative Learners - Xenia, and Legacy Christian Academy.
Ownership History
Date
Name
Owned For
Owner Type
Purchase Details
Closed on
Sep 23, 2021
Sold by
Reposky Andrew J and Reposky Grace M
Bought by
Reposky Andrew J and Reposky Grace M
Current Estimated Value
Purchase Details
Closed on
Aug 18, 2020
Sold by
Eaton Vera L and Buffenbarger Kimberly J
Bought by
Reposky Andrew J and Reposky Grace M
Purchase Details
Closed on
Dec 18, 2017
Sold by
Eaton Vera L
Bought by
Buffenbarger Kimberly and Devoe Julie L
Purchase Details
Closed on
Aug 27, 1999
Sold by
Williams Rick R and Williams Carol S
Bought by
Eaton Vera L
Purchase Details
Closed on
May 14, 1999
Sold by
Palmer Carrie I
Bought by
Williams Rick R and Williams Carol S
Home Financials for this Owner
Home Financials are based on the most recent Mortgage that was taken out on this home.
Original Mortgage
$103,500
Interest Rate
10.12%
Create a Home Valuation Report for This Property
The Home Valuation Report is an in-depth analysis detailing your home's value as well as a comparison with similar homes in the area
Home Values in the Area
Average Home Value in this Area
Purchase History
| Date | Buyer | Sale Price | Title Company |
|---|---|---|---|
| Reposky Andrew J | -- | None Available | |
| Reposky Andrew J | $169,000 | None Available | |
| Buffenbarger Kimberly | -- | -- | |
| Eaton Vera L | $117,900 | -- | |
| Williams Rick R | $115,000 | -- |
Source: Public Records
Mortgage History
| Date | Status | Borrower | Loan Amount |
|---|---|---|---|
| Previous Owner | Williams Rick R | $103,500 |
Source: Public Records
Tax History Compared to Growth
Tax History
| Year | Tax Paid | Tax Assessment Tax Assessment Total Assessment is a certain percentage of the fair market value that is determined by local assessors to be the total taxable value of land and additions on the property. | Land | Improvement |
|---|---|---|---|---|
| 2024 | $2,508 | $69,940 | $13,020 | $56,920 |
| 2023 | $2,508 | $69,940 | $13,020 | $56,920 |
| 2022 | $2,565 | $51,130 | $8,140 | $42,990 |
| 2021 | $2,600 | $56,680 | $13,690 | $42,990 |
| 2020 | $2,274 | $56,680 | $13,690 | $42,990 |
| 2019 | $1,994 | $48,320 | $13,880 | $34,440 |
| 2018 | $2,002 | $48,320 | $13,880 | $34,440 |
| 2017 | $1,855 | $48,320 | $13,880 | $34,440 |
| 2016 | $1,855 | $44,750 | $13,880 | $30,870 |
| 2015 | $1,860 | $44,750 | $13,880 | $30,870 |
| 2014 | $1,780 | $44,750 | $13,880 | $30,870 |
Source: Public Records
Map
Nearby Homes
- 348 S Stadium Dr
- 479 N Stadium Dr
- 119 Park Dr
- 659 N King St
- 516 N King St
- 508 Marshall Dr
- 568 Louise Dr
- 513 Redbud Ln
- 137 Pleasant St
- 214 Corwin Ave
- 878 N Detroit St
- 613 N West St
- 902 N Detroit St
- 610 Saxony Dr
- 0 W Church St
- 656 Eden Roc Dr
- 1038 Frederick Dr
- 645 E Church St
- 612 E Market St
- 1171 N Detroit St