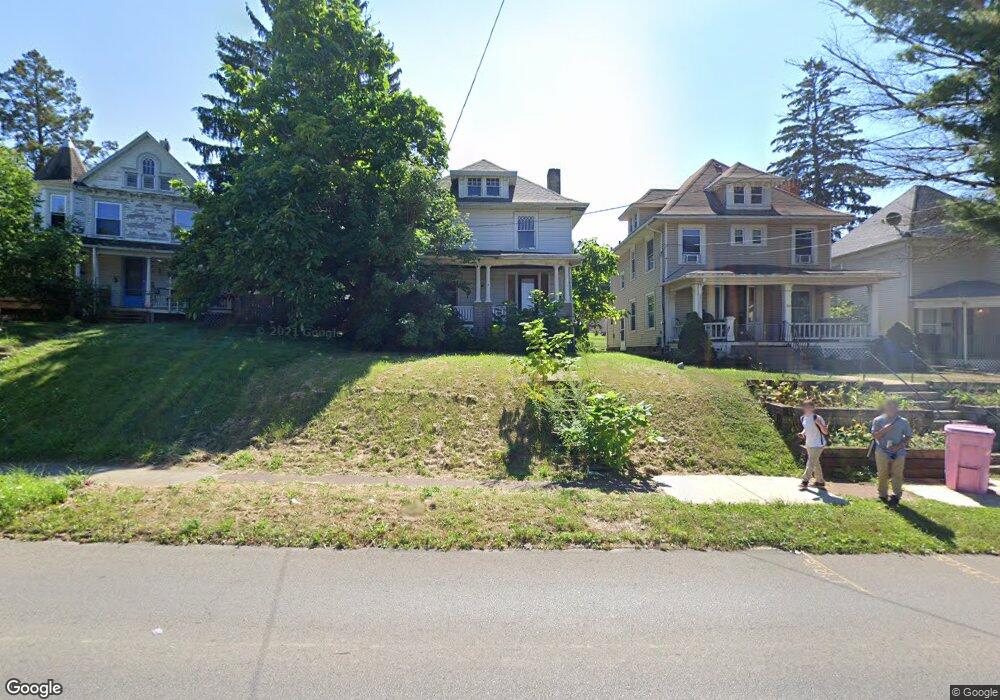
559 W 4th St Mansfield, OH 44903
Estimated Value: $58,000 - $90,000
3
Beds
2
Baths
1,977
Sq Ft
$39/Sq Ft
Est. Value
About This Home
This home is located at 559 W 4th St, Mansfield, OH 44903 and is currently estimated at $76,619, approximately $38 per square foot. 559 W 4th St is a home located in Richland County with nearby schools including Goal Digital Academy, Mansfield Elective Academy, and Interactive Media & Construction (IMAC) Academy.
Ownership History
Date
Name
Owned For
Owner Type
Purchase Details
Closed on
Nov 10, 2021
Sold by
Derek Pridgett
Bought by
Raber Nolan
Current Estimated Value
Purchase Details
Closed on
Oct 11, 2018
Sold by
Gregory Charles F and Treasurer Of Richland
Bought by
Pridgett Derek
Purchase Details
Closed on
Sep 18, 2008
Sold by
Gregory Charles E
Bought by
Black Chad Jason and Black Lisa Michelle
Home Financials for this Owner
Home Financials are based on the most recent Mortgage that was taken out on this home.
Original Mortgage
$30,000
Interest Rate
7%
Mortgage Type
Seller Take Back
Purchase Details
Closed on
Jun 14, 2007
Sold by
Hartman Stephen C and Hartman Karen
Bought by
Gregory Charles F
Purchase Details
Closed on
Aug 17, 2001
Sold by
Hartman Thomas H
Bought by
Hartman Stephen C
Home Financials for this Owner
Home Financials are based on the most recent Mortgage that was taken out on this home.
Original Mortgage
$11,000
Interest Rate
7.23%
Mortgage Type
New Conventional
Create a Home Valuation Report for This Property
The Home Valuation Report is an in-depth analysis detailing your home's value as well as a comparison with similar homes in the area
Home Values in the Area
Average Home Value in this Area
Purchase History
We collect this data history from publicly available records. To have your information removed, we recommend requesting removal directly through your county’s website.
| Date | Buyer | Sale Price | Title Company |
|---|---|---|---|
| Raber Nolan | -- | New Title Company Name | |
| Raber Nolan | -- | New Title Company Name | |
| Pridgett Derek | $6,200 | None Available | |
| Black Chad Jason | $30,000 | None Available | |
| Gregory Charles F | $28,000 | Versatitle Services Ltd | |
| Hartman Stephen C | $11,000 | -- |
Source: Public Records
Mortgage History
We collect this data history from publicly available records. To have your information removed, we recommend requesting removal directly through your county’s website.
| Date | Status | Borrower | Loan Amount |
|---|---|---|---|
| Previous Owner | Black Chad Jason | $30,000 | |
| Previous Owner | Hartman Stephen C | $11,000 |
Source: Public Records
Tax History
| Year | Tax Paid | Tax Assessment Tax Assessment Total Assessment is a certain percentage of the fair market value that is determined by local assessors to be the total taxable value of land and additions on the property. | Land | Improvement |
|---|---|---|---|---|
| 2025 | $249 | $5,200 | $1,270 | $3,930 |
| 2024 | $249 | $5,200 | $1,270 | $3,930 |
| 2023 | $249 | $5,200 | $1,270 | $3,930 |
| 2022 | $629 | $11,010 | $1,270 | $9,740 |
| 2021 | $736 | $11,010 | $1,270 | $9,740 |
| 2020 | $648 | $11,010 | $1,270 | $9,740 |
| 2019 | $718 | $11,010 | $1,270 | $9,740 |
| 2018 | $708 | $11,010 | $1,270 | $9,740 |
| 2017 | $762 | $11,010 | $1,270 | $9,740 |
| 2016 | $834 | $12,910 | $2,680 | $10,230 |
| 2015 | $796 | $12,910 | $2,680 | $10,230 |
| 2014 | $786 | $12,910 | $2,680 | $10,230 |
| 2012 | $602 | $12,910 | $2,820 | $10,090 |
Source: Public Records
Map
Nearby Homes
- 519 Heineman Blvd
- 509 Heineman Blvd
- 604 W 4th St
- 470 W 4th St
- 458 W West Dickson Ave
- 220 Atcheson Ave
- 406 Sherman Place
- 444 W 6th St
- 400 W 5th St
- 42 Parkwood Blvd
- 30 Douglas Ave
- 344 W 5th St
- 625 Sackman St
- 0 Lemley Ave Unit 9070540
- 93 Parkwood Blvd
- 108 Stewart Ave S
- 116 Stewart Ave S
- 51 Lind Ave
- 283 Park Ave W
- 255 W 5th St
Your Personal Tour Guide
Ask me questions while you tour the home.