
Landlord's Agent in 2019
Violetta Yoder
Virtual Properties Realty.BIZ
(770) 715-4998
5 Total Sales
Estimated Value: $748,681 - $936,000
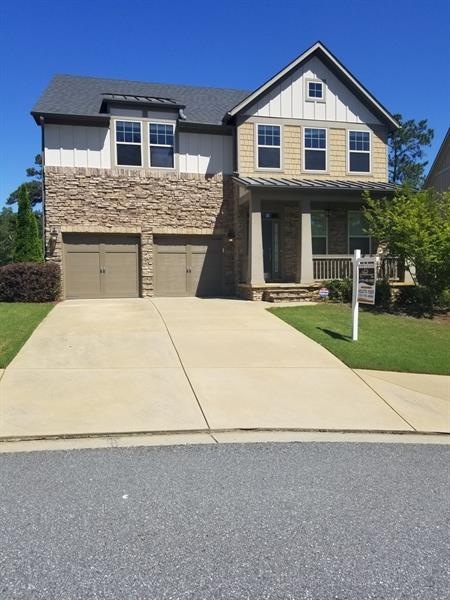
Price just reduced ! Gorgeous home in excellent condition, within walking distance of Northview High School. Elevated back porch runs the length of the house and overlooks a beautiful wooded area with creek. Each adult applicant 18 years or older will be required to fill out an application form, to be provided by the listing agent, at a cost of $45 per form.
Last Agent to Rent the Property
Virtual Properties Realty. Biz License #357258 Listed on: 05/13/2019
Last Renter's Agent
NON-MLS NMLS
Non FMLS Member
| Date | Event | Price | List to Sale | Price per Sq Ft |
|---|---|---|---|---|
| 06/30/2019 06/30/19 | Rented | $2,650 | 0.0% | -- |
| 06/04/2019 06/04/19 | Price Changed | $2,650 | -5.4% | $1 / Sq Ft |
| 05/13/2019 05/13/19 | For Rent | $2,800 | -- | -- |
| Year | Tax Paid | Tax Assessment Tax Assessment Total Assessment is a certain percentage of the fair market value that is determined by local assessors to be the total taxable value of land and additions on the property. | Land | Improvement |
|---|---|---|---|---|
| 2025 | $5,624 | $283,160 | $86,880 | $196,280 |
| 2023 | $5,288 | $187,360 | $38,880 | $148,480 |
| 2022 | $5,749 | $187,360 | $38,880 | $148,480 |
| 2021 | $5,732 | $181,920 | $37,760 | $144,160 |
| 2020 | $5,785 | $179,720 | $37,280 | $142,440 |
| 2019 | $696 | $176,560 | $36,640 | $139,920 |
| 2018 | $5,615 | $172,400 | $35,760 | $136,640 |
| 2017 | $5,278 | $155,080 | $12,560 | $142,520 |
| 2016 | $5,363 | $159,880 | $12,560 | $147,320 |
| 2015 | $5,351 | $157,760 | $12,560 | $145,200 |
| 2014 | $5,564 | $157,760 | $12,560 | $145,200 |
Landlord's Agent in 2019
Violetta Yoder
Virtual Properties Realty.BIZ
(770) 715-4998
5 Total Sales
N
Tenant's Agent in 2019
NON-MLS NMLS
Non FMLS Member
Source: First Multiple Listing Service (FMLS)
MLS Number: 6552706
APN: 11-0790-0263-138-1
Disclaimer: Certain information contained herein is derived from information provided by parties other than Homes.com. All information provided is deemed reliable, but is not guaranteed to be accurate and should be independently verified.
![]() Listings identified with the FMLS IDX logo come from FMLS and are held by brokerage firms other than the owner of this website. The listing brokerage is identified in any listing details. Information is deemed reliable but is not guaranteed. If you believe any FMLS listing contains material that infringes your copyrighted work please visit www.fmls.com/dmca to review our DMCA policy and learn how to submit a takedown request. © 2025 First Multiple Listing Service, Inc.
Listings identified with the FMLS IDX logo come from FMLS and are held by brokerage firms other than the owner of this website. The listing brokerage is identified in any listing details. Information is deemed reliable but is not guaranteed. If you believe any FMLS listing contains material that infringes your copyrighted work please visit www.fmls.com/dmca to review our DMCA policy and learn how to submit a takedown request. © 2025 First Multiple Listing Service, Inc.