Estimated Value: $437,023 - $498,000
3
Beds
3
Baths
1,652
Sq Ft
$285/Sq Ft
Est. Value
About This Home
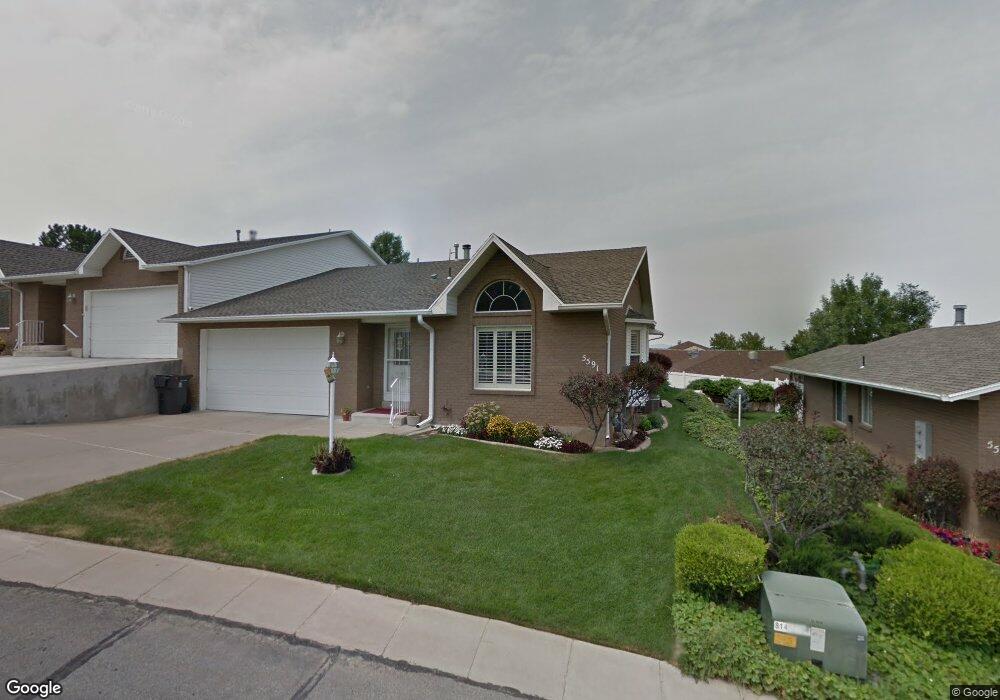
This home is located at 5591 S 1100 E, Ogden, UT 84405 and is currently estimated at $471,506, approximately $285 per square foot. 5591 S 1100 E is a home located in Weber County with nearby schools including H Guy Child School, South Ogden Junior High School, and Bonneville High School.
Ownership History
Date
Name
Owned For
Owner Type
Purchase Details
Closed on
May 25, 2016
Sold by
Jensen Robert V and Jensen Linda L
Bought by
Jensen Robert V
Current Estimated Value
Purchase Details
Closed on
Aug 4, 2015
Sold by
Wichern Sarah and Wichern Brent W
Bought by
Jensen Robert and Jensen Linda L
Purchase Details
Closed on
Oct 15, 2012
Sold by
Wichern Sarah
Bought by
Wichern Sarah
Home Financials for this Owner
Home Financials are based on the most recent Mortgage that was taken out on this home.
Original Mortgage
$202,482
Interest Rate
3.75%
Mortgage Type
FHA
Purchase Details
Closed on
Aug 7, 2009
Sold by
Richardson Donna P and The Donna P Richardson Trust
Bought by
Wichern Sarah
Home Financials for this Owner
Home Financials are based on the most recent Mortgage that was taken out on this home.
Original Mortgage
$218,000
Interest Rate
5.37%
Mortgage Type
Seller Take Back
Create a Home Valuation Report for This Property
The Home Valuation Report is an in-depth analysis detailing your home's value as well as a comparison with similar homes in the area
Home Values in the Area
Average Home Value in this Area
Purchase History
| Date | Buyer | Sale Price | Title Company |
|---|---|---|---|
| Jensen Robert V | -- | None Available | |
| Jensen Robert | -- | Mountain View Title Ogden | |
| Wichern Sarah | -- | Mountain View Title | |
| Wichern Sarah | -- | Accommodation | |
| The Donna P Richardson Trust | -- | Accommodation |
Source: Public Records
Mortgage History
| Date | Status | Borrower | Loan Amount |
|---|---|---|---|
| Previous Owner | Wichern Sarah | $202,482 | |
| Previous Owner | Wichern Sarah | $218,000 |
Source: Public Records
Tax History
| Year | Tax Paid | Tax Assessment Tax Assessment Total Assessment is a certain percentage of the fair market value that is determined by local assessors to be the total taxable value of land and additions on the property. | Land | Improvement |
|---|---|---|---|---|
| 2025 | $2,995 | $465,865 | $115,000 | $350,865 |
| 2024 | $2,860 | $249,700 | $63,250 | $186,450 |
| 2023 | $2,968 | $259,600 | $63,250 | $196,350 |
| 2022 | $2,962 | $265,100 | $63,250 | $201,850 |
| 2021 | $2,686 | $408,000 | $80,000 | $328,000 |
| 2020 | $2,349 | $333,000 | $50,000 | $283,000 |
| 2019 | $2,360 | $321,000 | $50,000 | $271,000 |
| 2018 | $1,364 | $300,000 | $50,000 | $250,000 |
| 2017 | $1,056 | $250,300 | $44,000 | $206,300 |
| 2016 | $1,841 | $129,250 | $22,000 | $107,250 |
| 2015 | $1,761 | $121,000 | $22,000 | $99,000 |
| 2014 | $1,561 | $105,600 | $22,000 | $83,600 |
Source: Public Records
Map
Nearby Homes
- 5558 S 1025 E
- 5505 S 1025 E
- 5619 S Fox Chase Dr E
- 992 E 5625 S
- 977 E 5550 S
- 980 E 5475 S
- 994 E 5750 S
- 5760 S 1050 E
- 1143 E 5275 S Unit 33
- 1205 E 5275 S Unit 34
- 1225 E 5275 S
- 5263 Daybreak Dr
- 5659 Fox Chase Dr
- 5518 S 875 E
- 5813 S Main Point Blvd
- 5660 S 1425 E Unit E3
- 5540 S 850 E
- 856 E 5575 S
- 1314 E 5250 S
- 5492 S 825 E
Your Personal Tour Guide
Ask me questions while you tour the home.