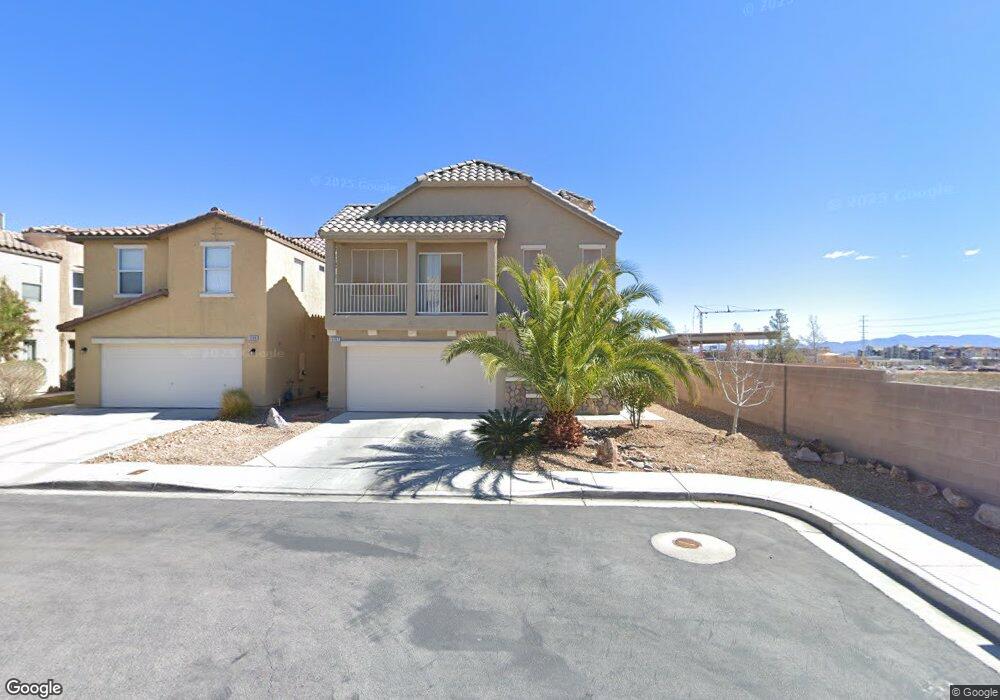
5592 Avent Ferry St Las Vegas, NV 89148
Estimated Value: $483,000 - $538,000
4
Beds
3
Baths
2,280
Sq Ft
$221/Sq Ft
Est. Value
About This Home
This home is located at 5592 Avent Ferry St, Las Vegas, NV 89148 and is currently estimated at $504,296, approximately $221 per square foot. 5592 Avent Ferry St is a home located in Clark County with nearby schools including Kathy L. Batterman Elementary School, Victoria Fertitta Middle School, and Durango High School.
Ownership History
Date
Name
Owned For
Owner Type
Purchase Details
Closed on
Apr 13, 2011
Sold by
Citibank N A
Bought by
Khzarjyan Armen and Hovhannisyan Roza
Current Estimated Value
Home Financials for this Owner
Home Financials are based on the most recent Mortgage that was taken out on this home.
Original Mortgage
$155,944
Interest Rate
4.75%
Mortgage Type
FHA
Purchase Details
Closed on
May 19, 2010
Sold by
Georgiev Georgi
Bought by
Citibank Na
Purchase Details
Closed on
Feb 21, 2006
Sold by
Georgieva Ivanka
Bought by
Georgiev Georgi
Home Financials for this Owner
Home Financials are based on the most recent Mortgage that was taken out on this home.
Original Mortgage
$292,790
Interest Rate
7.12%
Mortgage Type
Unknown
Create a Home Valuation Report for This Property
The Home Valuation Report is an in-depth analysis detailing your home's value as well as a comparison with similar homes in the area
Home Values in the Area
Average Home Value in this Area
Purchase History
| Date | Buyer | Sale Price | Title Company |
|---|---|---|---|
| Khzarjyan Armen | $160,000 | Commerce Title & Closing | |
| Citibank Na | $157,500 | Accommodation | |
| Georgiev Georgi | -- | Stewart Title Of Nevada | |
| Georgiev Georgi | $365,990 | Stewart Title Of Nevada |
Source: Public Records
Mortgage History
| Date | Status | Borrower | Loan Amount |
|---|---|---|---|
| Previous Owner | Khzarjyan Armen | $155,944 | |
| Previous Owner | Georgiev Georgi | $292,790 |
Source: Public Records
Tax History Compared to Growth
Tax History
| Year | Tax Paid | Tax Assessment Tax Assessment Total Assessment is a certain percentage of the fair market value that is determined by local assessors to be the total taxable value of land and additions on the property. | Land | Improvement |
|---|---|---|---|---|
| 2025 | $2,158 | $128,586 | $43,750 | $84,836 |
| 2024 | $2,096 | $128,586 | $43,750 | $84,836 |
| 2023 | $2,096 | $116,374 | $36,400 | $79,974 |
| 2022 | $2,231 | $99,521 | $26,600 | $72,921 |
| 2021 | $2,066 | $94,444 | $25,200 | $69,244 |
| 2020 | $1,915 | $96,594 | $28,000 | $68,594 |
| 2019 | $1,795 | $88,045 | $20,650 | $67,395 |
| 2018 | $1,713 | $81,719 | $17,500 | $64,219 |
| 2017 | $2,386 | $81,356 | $16,450 | $64,906 |
| 2016 | $1,604 | $79,152 | $14,350 | $64,802 |
| 2015 | $1,600 | $74,662 | $10,850 | $63,812 |
| 2014 | $1,553 | $51,382 | $7,350 | $44,032 |
Source: Public Records
Map
Nearby Homes
- 9472 W Diablo Dr
- 5554 Chicory Falls Ct
- 9750 Maple Sugar Leaf Place
- 9687 Ridgebluff Ave
- 9631 Tuscola Ct
- 5697 Tapestry Rose Ct
- 9580 Magnificent Ave
- 9460 Magnificent Ave
- 5533 Sterling Valley Ct
- 5831 Sleepy Willow St
- 5548 Anshan St
- 9522 Arrowhead Falls Ct
- 5915 Poplar Tree St Unit 7
- 9691 Loud Water Way
- 9238 Stonewall Ridge Ct
- 5544 Jinsha River St
- 9233 Hudson Yards Ct
- 9862 Shadow Grove Ave
- 9305 Briar Bridge Ave
- 9217 Valley Betica Ave
- 5586 Avent Ferry St
- 5580 Avent Ferry St
- 5574 Avent Ferry St
- 9517 Birch Basin Ct
- 5555 Baker Bowl Ct
- 9525 Birch Basin Ct
- 5562 Avent Ferry St
- 5556 Baker Bowl Ct
- 9533 Birch Basin Ct
- 5556 Avent Ferry St
- 9541 Birch Basin Ct
- 9499 Kaufman Rd
- 5552 Baker Bowl Ct
- 9524 Birch Basin Ct Unit none
- 9524 Birch Basin Ct
- 5548 Baker Bowl Ct
- 5550 Avent Ferry St
- 9532 Birch Basin Ct
- 9549 Birch Basin Ct
- 5544 Baker Bowl Ct