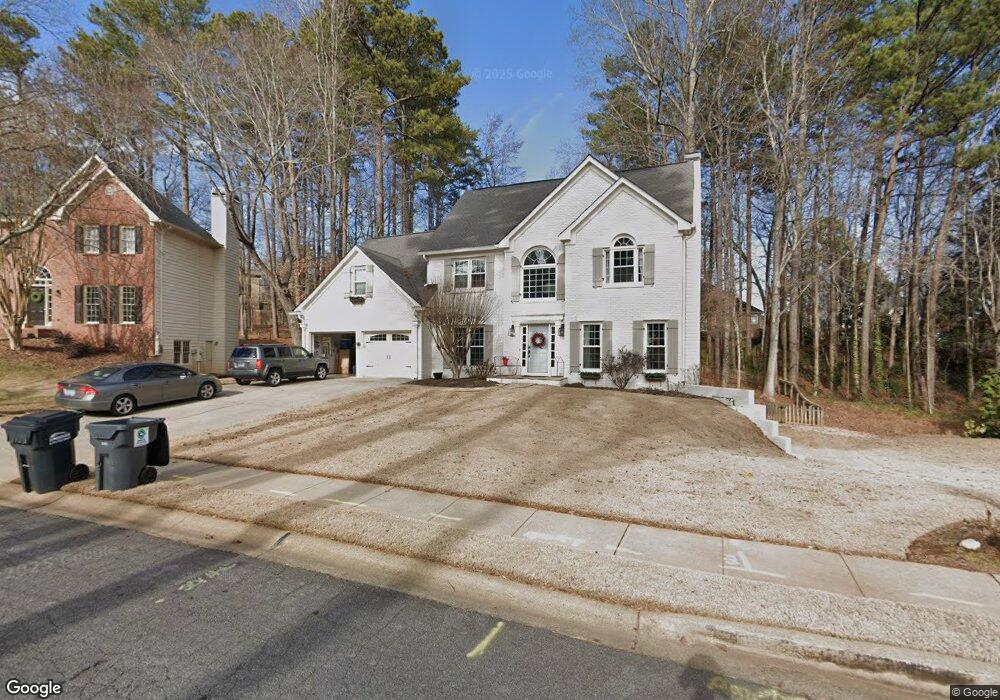
5594 Forkwood Dr NW Unit IV Acworth, GA 30101
Estimated Value: $512,309 - $591,000
3
Beds
3
Baths
3,086
Sq Ft
$182/Sq Ft
Est. Value
About This Home
This home is located at 5594 Forkwood Dr NW Unit IV, Acworth, GA 30101 and is currently estimated at $562,077, approximately $182 per square foot. 5594 Forkwood Dr NW Unit IV is a home located in Cobb County with nearby schools including Pickett's Mill Elementary School, Durham Middle School, and Allatoona High School.
Ownership History
Date
Name
Owned For
Owner Type
Purchase Details
Closed on
Oct 4, 2002
Sold by
Barfield Patsy
Bought by
Sawick Michael A
Current Estimated Value
Home Financials for this Owner
Home Financials are based on the most recent Mortgage that was taken out on this home.
Original Mortgage
$187,600
Outstanding Balance
$78,765
Interest Rate
6.18%
Mortgage Type
New Conventional
Estimated Equity
$483,312
Purchase Details
Closed on
Dec 18, 1998
Sold by
Smith Richard and Smith Sonia C
Bought by
Barfield Patsy
Home Financials for this Owner
Home Financials are based on the most recent Mortgage that was taken out on this home.
Original Mortgage
$160,000
Interest Rate
6.94%
Mortgage Type
New Conventional
Purchase Details
Closed on
Jun 20, 1996
Sold by
Nilsen Matthew L Deana
Bought by
Smith Richard Sonia
Create a Home Valuation Report for This Property
The Home Valuation Report is an in-depth analysis detailing your home's value as well as a comparison with similar homes in the area
Home Values in the Area
Average Home Value in this Area
Purchase History
| Date | Buyer | Sale Price | Title Company |
|---|---|---|---|
| Sawick Michael A | $234,500 | -- | |
| Barfield Patsy | $200,000 | -- | |
| Smith Richard Sonia | $220,000 | -- |
Source: Public Records
Mortgage History
| Date | Status | Borrower | Loan Amount |
|---|---|---|---|
| Open | Sawick Michael A | $187,600 | |
| Previous Owner | Barfield Patsy | $160,000 | |
| Closed | Smith Richard Sonia | $0 |
Source: Public Records
Tax History Compared to Growth
Tax History
| Year | Tax Paid | Tax Assessment Tax Assessment Total Assessment is a certain percentage of the fair market value that is determined by local assessors to be the total taxable value of land and additions on the property. | Land | Improvement |
|---|---|---|---|---|
| 2024 | $1,395 | $214,744 | $52,000 | $162,744 |
| 2023 | $1,056 | $170,352 | $34,000 | $136,352 |
| 2022 | $4,293 | $170,352 | $34,000 | $136,352 |
| 2021 | $3,426 | $130,756 | $34,000 | $96,756 |
| 2020 | $3,251 | $122,756 | $26,000 | $96,756 |
| 2019 | $3,251 | $122,756 | $26,000 | $96,756 |
| 2018 | $2,824 | $103,244 | $24,000 | $79,244 |
| 2017 | $2,683 | $103,244 | $24,000 | $79,244 |
| 2016 | $2,684 | $103,244 | $24,000 | $79,244 |
| 2015 | $2,657 | $99,028 | $24,000 | $75,028 |
| 2014 | $2,679 | $99,028 | $0 | $0 |
Source: Public Records
Map
Nearby Homes
- 5485 Brookstone Dr NW
- 5711 Brynwood Cir NW
- 1496 Fallsbrook Ct NW
- 1799 Mclain Rd NW
- 1474 Fallsbrook Ct NW Unit 3
- 1314 Fallsbrook Terrace NW
- 5719 Brookstone Walk NW
- 1313 Fallsbrook Terrace NW
- 5362 Manor View Dr NW Unit 12
- 5256 Middleton Place NW
- 5396 Turnbill Point NW
- 1377 Downington Ln NW
- 5654 Brookstone Dr NW
- 1963 Heatherbrooke Ln NW
- 1390 Downington View NW Unit VI
- The Ashburn Plan at Woodford
- The Rebecca Plan at Woodford
- The Dillard Plan at Woodford
- The Oxford Plan at Woodford
- 5596 Forkwood Dr NW
- 5592 Forkwood Dr NW
- 1689 Brookgreen View NW
- 1687 Brookgreen View NW
- 5569 Brookgreen Dr NW
- 5571 Brookgreen Dr NW
- 1678 Mclain Rd NW
- 5590 Forkwood Dr NW
- 5595 Forkwood Dr NW
- 5573 Brookgreen Dr NW
- 5593 Forkwood Dr NW
- 0 Brookgreen View NW Unit 7282715
- 0 Brookgreen View NW
- 0 Brookgreen Dr NW Unit 7344976
- 0 Brookgreen Dr NW Unit 7221181
- 0 Brookgreen Dr NW Unit 8367243
- 0 Brookgreen Dr NW Unit 8127513
- 0 Brookgreen Dr NW Unit 7623703
- 0 Brookgreen Dr NW Unit 8063528
- 0 Brookgreen Dr NW Unit 9072052