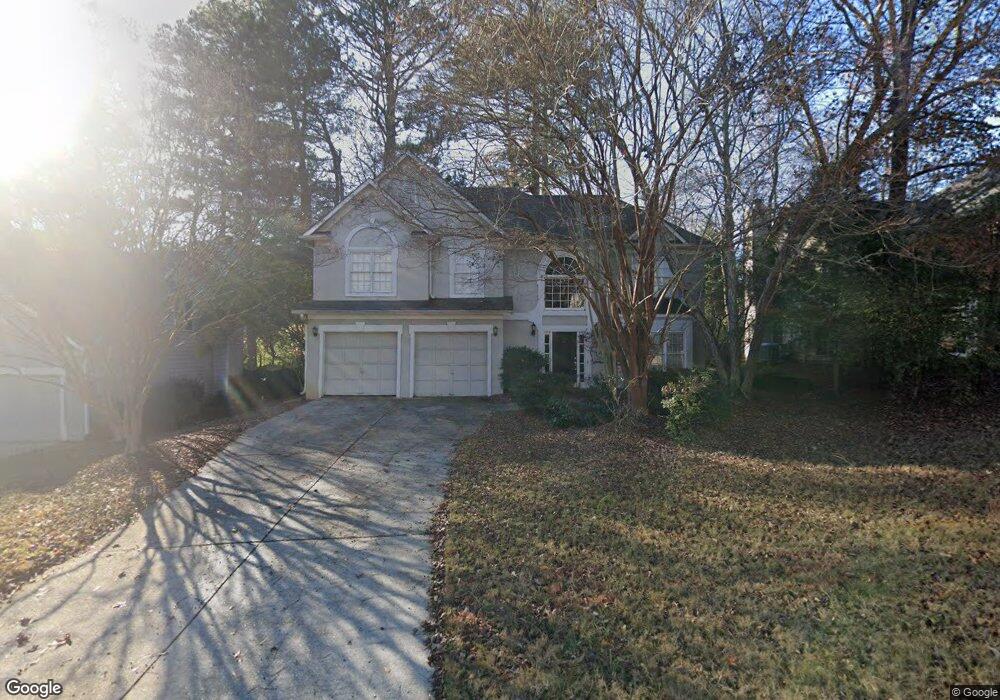
5595 Hillgate Crossing Unit 3 Alpharetta, GA 30005
Estimated Value: $606,000 - $692,000
4
Beds
3
Baths
2,602
Sq Ft
$253/Sq Ft
Est. Value
About This Home
This home is located at 5595 Hillgate Crossing Unit 3, Alpharetta, GA 30005 and is currently estimated at $657,935, approximately $252 per square foot. 5595 Hillgate Crossing Unit 3 is a home located in Fulton County with nearby schools including Abbotts Hill Elementary School, Taylor Road Middle School, and Chattahoochee High School.
Ownership History
Date
Name
Owned For
Owner Type
Purchase Details
Closed on
Jan 22, 2002
Sold by
Dannenbaum Robert
Bought by
Dannenbaum Robert and Dannenbaum Shelley
Current Estimated Value
Home Financials for this Owner
Home Financials are based on the most recent Mortgage that was taken out on this home.
Original Mortgage
$142,000
Interest Rate
7.16%
Mortgage Type
New Conventional
Purchase Details
Closed on
Dec 29, 1997
Sold by
Moses Stephen T and Moses Leisa
Bought by
Dannenbaum Robt
Home Financials for this Owner
Home Financials are based on the most recent Mortgage that was taken out on this home.
Original Mortgage
$142,000
Interest Rate
7.07%
Mortgage Type
New Conventional
Purchase Details
Closed on
Dec 5, 1996
Sold by
Shaprio Robert S Ilicia A
Bought by
Moses Stephen T Leisa W
Create a Home Valuation Report for This Property
The Home Valuation Report is an in-depth analysis detailing your home's value as well as a comparison with similar homes in the area
Home Values in the Area
Average Home Value in this Area
Purchase History
| Date | Buyer | Sale Price | Title Company |
|---|---|---|---|
| Dannenbaum Robert | -- | -- | |
| Dannenbaum Robt | $162,000 | -- | |
| Moses Stephen T Leisa W | $171,500 | -- |
Source: Public Records
Mortgage History
| Date | Status | Borrower | Loan Amount |
|---|---|---|---|
| Closed | Dannenbaum Robert | $142,000 | |
| Previous Owner | Dannenbaum Robt | $142,000 | |
| Closed | Moses Stephen T Leisa W | $0 |
Source: Public Records
Tax History Compared to Growth
Tax History
| Year | Tax Paid | Tax Assessment Tax Assessment Total Assessment is a certain percentage of the fair market value that is determined by local assessors to be the total taxable value of land and additions on the property. | Land | Improvement |
|---|---|---|---|---|
| 2025 | $3,605 | $249,960 | $56,440 | $193,520 |
| 2023 | $5,988 | $212,160 | $43,880 | $168,280 |
| 2022 | $3,446 | $179,360 | $40,520 | $138,840 |
| 2021 | $3,395 | $138,360 | $35,360 | $103,000 |
| 2020 | $3,410 | $130,800 | $28,840 | $101,960 |
| 2019 | $422 | $128,480 | $28,320 | $100,160 |
| 2018 | $3,471 | $125,480 | $27,640 | $97,840 |
| 2017 | $3,362 | $114,840 | $29,360 | $85,480 |
| 2016 | $3,042 | $109,000 | $29,360 | $79,640 |
| 2015 | $2,959 | $104,040 | $29,360 | $74,680 |
| 2014 | $2,507 | $84,120 | $23,720 | $60,400 |
Source: Public Records
Map
Nearby Homes
- 1660 Gladewood Dr
- 5610 N Hillbrooke Trace
- 5325 Hillgate Crossing
- 335 Dunhill Way Ct
- 130 Wyndlam Ct
- 11615 Windbrooke Way
- 11260 Donnington Dr
- 775 Ellsborough Ct
- 5575 Ashwind Trace
- 5160 Abbotts Bridge Rd
- 6365 Murets Rd
- 11420 Crossington Rd
- 5785 Oxborough Way Unit 1
- 5680 Abbotts Bridge Rd
- 11235 Surrey Park Trail
- 11619 Davenport Ln
- 5690 Abbotts Bridge Rd
- 5585 Hillgate Crossing
- 5605 Hillgate Crossing
- 0 Hilgate
- 5575 Hillgate Crossing
- 1630 Gladewood Dr
- 5615 Hillgate Crossing
- 1640 Gladewood Dr
- 1650 Gladewood Dr
- 1620 Gladewood Dr
- 5630 Hillgate Crossing
- 1610 Gladewood Dr Unit 3
- 5620 Hillgate Crossing Unit 3
- 5640 Hillgate Crossing
- 1600 Gladewood Dr
- 5610 Hillgate Crossing
- 0 Gladewood Dr Unit 8619066
- 0 Gladewood Dr Unit 8735130
- 0 Gladewood Dr Unit 8861849
- 0 Gladewood Dr
- 5650 Hillgate Crossing