Estimated Value: $475,000 - $495,000
4
Beds
4
Baths
1,993
Sq Ft
$242/Sq Ft
Est. Value
About This Home
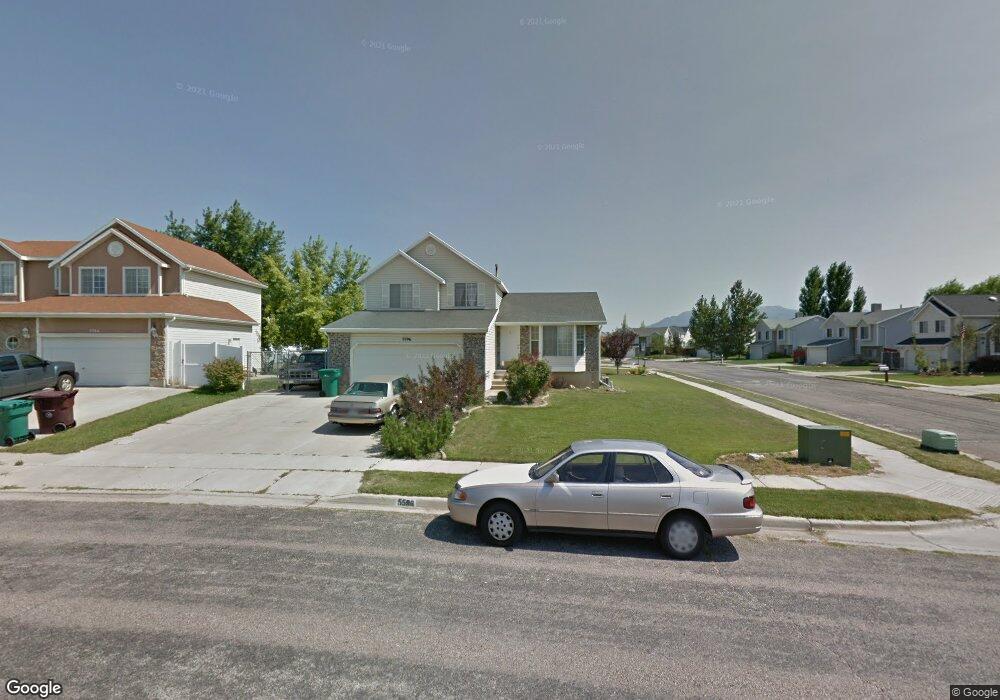
This home is located at 5596 S 4225 W, Roy, UT 84067 and is currently estimated at $481,560, approximately $241 per square foot. 5596 S 4225 W is a home located in Weber County with nearby schools including Freedom School, Roy Junior High School, and Roy High School.
Ownership History
Date
Name
Owned For
Owner Type
Purchase Details
Closed on
Aug 30, 2017
Sold by
Sessions Alicia M
Bought by
Juarez Alfredo and Simmons Stefanie
Current Estimated Value
Home Financials for this Owner
Home Financials are based on the most recent Mortgage that was taken out on this home.
Original Mortgage
$238,598
Outstanding Balance
$201,091
Interest Rate
4.25%
Mortgage Type
FHA
Estimated Equity
$280,469
Purchase Details
Closed on
May 4, 2010
Sold by
Washington Lillie Burrell
Bought by
Karr Jim and Karr Gayle Ann
Home Financials for this Owner
Home Financials are based on the most recent Mortgage that was taken out on this home.
Original Mortgage
$178,594
Interest Rate
5.25%
Mortgage Type
FHA
Purchase Details
Closed on
Jan 12, 1996
Sold by
Gmw Development Inc
Bought by
Burrell James E
Home Financials for this Owner
Home Financials are based on the most recent Mortgage that was taken out on this home.
Original Mortgage
$116,452
Interest Rate
7.37%
Mortgage Type
VA
Create a Home Valuation Report for This Property
The Home Valuation Report is an in-depth analysis detailing your home's value as well as a comparison with similar homes in the area
Home Values in the Area
Average Home Value in this Area
Purchase History
| Date | Buyer | Sale Price | Title Company |
|---|---|---|---|
| Juarez Alfredo | -- | Us Title Insurance Agency | |
| Karr Jim | -- | Cottonwood Title | |
| Burrell James E | -- | Bonneville Title | |
| Gmw Development Inc | -- | Bonneville Title |
Source: Public Records
Mortgage History
| Date | Status | Borrower | Loan Amount |
|---|---|---|---|
| Open | Juarez Alfredo | $238,598 | |
| Previous Owner | Karr Jim | $178,594 | |
| Previous Owner | Burrell James E | $116,452 |
Source: Public Records
Tax History Compared to Growth
Tax History
| Year | Tax Paid | Tax Assessment Tax Assessment Total Assessment is a certain percentage of the fair market value that is determined by local assessors to be the total taxable value of land and additions on the property. | Land | Improvement |
|---|---|---|---|---|
| 2025 | $2,940 | $471,810 | $142,554 | $329,256 |
| 2024 | $2,842 | $459,000 | $142,569 | $316,431 |
| 2023 | $2,734 | $442,000 | $125,457 | $316,543 |
| 2022 | $2,986 | $500,000 | $114,526 | $385,474 |
| 2021 | $2,282 | $343,000 | $83,142 | $259,858 |
| 2020 | $2,079 | $286,000 | $83,142 | $202,858 |
| 2019 | $2,135 | $278,000 | $47,672 | $230,328 |
| 2018 | $2,129 | $262,000 | $42,557 | $219,443 |
| 2017 | $2,020 | $233,000 | $42,557 | $190,443 |
| 2016 | $1,849 | $114,064 | $22,430 | $91,634 |
| 2015 | $1,544 | $96,129 | $22,430 | $73,699 |
| 2014 | $1,413 | $86,023 | $19,769 | $66,254 |
Source: Public Records
Map
Nearby Homes
- 5539 S 4175 W
- 5644 S 4075 W
- 5465 S 4050 W
- 4309 W 5430 St #B S
- 5778 S 4075 W
- 3923 W 5700 S
- 4337 W 5430 S Unit A
- 3832 W 5625 S
- 4449 W 5325 S
- 5270 S 4200 W
- 4164 W 5950 S
- 3809 W 5625 S
- 5856 S 3950 W
- 5235 Midland Dr
- 5116 S 4300 W
- 462 S 4450 W Unit 504
- 4276 W 6025 S
- 3780 W 5850 S
- 4632 W 5750 S
- 3766 W 5300 S