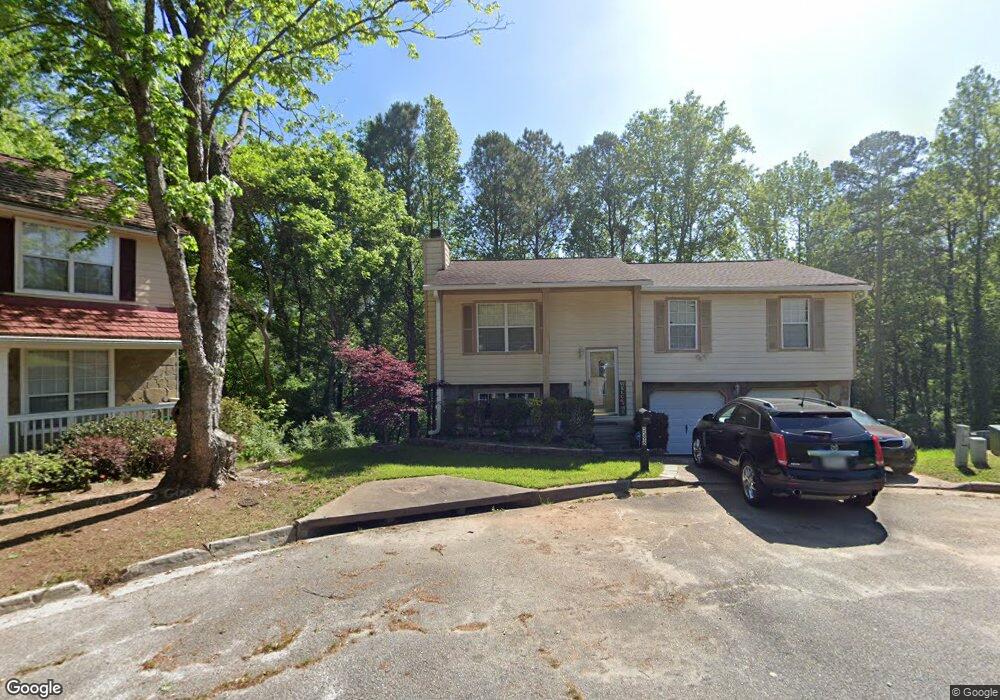
5596 Sapphire Spring Unit 1 Stone Mountain, GA 30088
Estimated Value: $243,301 - $265,000
3
Beds
3
Baths
1,715
Sq Ft
$148/Sq Ft
Est. Value
About This Home
This home is located at 5596 Sapphire Spring Unit 1, Stone Mountain, GA 30088 and is currently estimated at $253,825, approximately $148 per square foot. 5596 Sapphire Spring Unit 1 is a home located in DeKalb County with nearby schools including Redan Elementary School, Redan Middle School, and Redan High School.
Ownership History
Date
Name
Owned For
Owner Type
Purchase Details
Closed on
Feb 12, 2025
Sold by
Jackson Sheila
Bought by
Jackson Sheila and Jackson Tamirria
Current Estimated Value
Purchase Details
Closed on
Jul 2, 1998
Sold by
Pinnacle Constr Corp
Bought by
Jackson Perry L and Jackson Sheila
Home Financials for this Owner
Home Financials are based on the most recent Mortgage that was taken out on this home.
Original Mortgage
$75,200
Interest Rate
11.12%
Mortgage Type
New Conventional
Purchase Details
Closed on
Feb 28, 1997
Sold by
Osborne Elbert T
Bought by
Pinnacle Constco
Create a Home Valuation Report for This Property
The Home Valuation Report is an in-depth analysis detailing your home's value as well as a comparison with similar homes in the area
Home Values in the Area
Average Home Value in this Area
Purchase History
| Date | Buyer | Sale Price | Title Company |
|---|---|---|---|
| Jackson Sheila | -- | -- | |
| Jackson Perry L | $94,000 | -- | |
| Pinnacle Constco | $79,500 | -- |
Source: Public Records
Mortgage History
| Date | Status | Borrower | Loan Amount |
|---|---|---|---|
| Previous Owner | Jackson Perry L | $75,200 |
Source: Public Records
Tax History Compared to Growth
Tax History
| Year | Tax Paid | Tax Assessment Tax Assessment Total Assessment is a certain percentage of the fair market value that is determined by local assessors to be the total taxable value of land and additions on the property. | Land | Improvement |
|---|---|---|---|---|
| 2025 | $3,236 | $99,960 | $13,880 | $86,080 |
| 2024 | $3,331 | $97,880 | $13,880 | $84,000 |
| 2023 | $3,331 | $86,880 | $13,880 | $73,000 |
| 2022 | $2,355 | $70,840 | $13,880 | $56,960 |
| 2021 | $1,865 | $56,600 | $9,920 | $46,680 |
| 2020 | $1,723 | $52,360 | $9,920 | $42,440 |
| 2019 | $1,561 | $48,120 | $9,920 | $38,200 |
| 2018 | $1,300 | $48,560 | $3,960 | $44,600 |
| 2017 | $1,261 | $38,160 | $3,120 | $35,040 |
| 2016 | $1,049 | $32,880 | $3,120 | $29,760 |
| 2014 | $884 | $28,040 | $3,120 | $24,920 |
Source: Public Records
Map
Nearby Homes
- 5598 Emerald Glen
- 1355 Stoneleigh Way
- 5516 Mountain Springs Cir Unit 5516
- 1325 Stoneleigh Way
- 1311 Stoneleigh Way
- 1509 Burnstone Dr
- 1314 Stoneleigh Way Unit 2
- 1437 Stoneleigh Hill Rd
- 1545 Burnstone Dr
- 1554 Circlestone Dr Unit 1
- 5599 Redan Cir
- 1520 Stoneleigh Cir Unit 7
- 1378 Stoneleigh Hill Rd
- 5601 Tunbridge Wells Rd
- 1579 Dillard Rd
- 1609 Burnstone Dr
- 5521 Joeclay Dr
- 1821 Redan Rd
- 1593 Dillard Rd
- 1548 Stoneleigh Way
- 5595 Sapphire Spring
- 5592 Sapphire Springs
- 1400 Stoneleigh Way
- 5591 Sapphire Spring
- 1382 Stoneleigh Way
- 1390 Stoneleigh Way
- 5604 Emerald Glen Unit 66
- 5604 Emerald Glen
- 5623 Crystal Hill Unit 2
- 1376 Stoneleigh Way Unit 2
- 1410 Stoneleigh Way
- 5627 Crystal Hill
- 1370 Stoneleigh Way Unit 2
- 5594 Emerald Glen
- 5608 Emerald Glen Unit 2
- 5588 Emerald Glen
- 1397 Stoneleigh Way 0 Unit 14
- 5580 Emerald Glen
- 5574 Emerald Glen
- 1397 Stoneleigh Way Unit 14