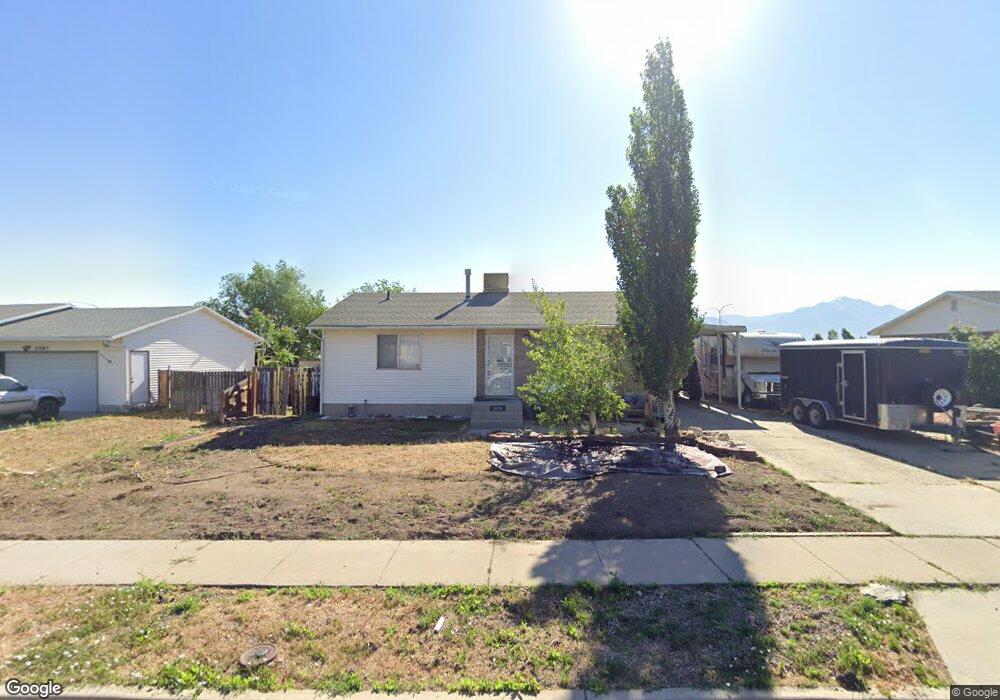
5599 Brandy Wine Salt Lake City, UT 84129
Estimated Value: $406,278 - $480,000
2
Beds
1
Bath
970
Sq Ft
$458/Sq Ft
Est. Value
About This Home
This home is located at 5599 Brandy Wine, Salt Lake City, UT 84129 and is currently estimated at $443,820, approximately $457 per square foot. 5599 Brandy Wine is a home located in Salt Lake County with nearby schools including Fox Hills Elementary School, Kearns Jr High School, and Kearns High School.
Ownership History
Date
Name
Owned For
Owner Type
Purchase Details
Closed on
Sep 30, 2020
Sold by
Kitchens Douglas Keith and Kitchens Susan Rich
Bought by
Kitchens Douglas K and Kitchens Susan R
Current Estimated Value
Purchase Details
Closed on
May 22, 2020
Sold by
Kitchens Douglas K and Kitchens Susan R
Bought by
Kitchens Susan Rich and Kitchens Douglas Keith
Home Financials for this Owner
Home Financials are based on the most recent Mortgage that was taken out on this home.
Original Mortgage
$118,500
Interest Rate
3.3%
Mortgage Type
New Conventional
Purchase Details
Closed on
Mar 18, 2009
Sold by
Kitchens Susan R
Bought by
Kitchens Douglas K and Kitchens Susan R
Home Financials for this Owner
Home Financials are based on the most recent Mortgage that was taken out on this home.
Original Mortgage
$124,000
Interest Rate
5.19%
Mortgage Type
New Conventional
Create a Home Valuation Report for This Property
The Home Valuation Report is an in-depth analysis detailing your home's value as well as a comparison with similar homes in the area
Home Values in the Area
Average Home Value in this Area
Purchase History
| Date | Buyer | Sale Price | Title Company |
|---|---|---|---|
| Kitchens Douglas K | -- | None Available | |
| Kitchens Susan Rich | -- | Stewart Title Ins Agcy Of Ut | |
| Kitchens Douglas K | -- | Highland Title Agency | |
| Kitchens Susan R | -- | Highland Title Agency |
Source: Public Records
Mortgage History
| Date | Status | Borrower | Loan Amount |
|---|---|---|---|
| Previous Owner | Kitchens Susan Rich | $118,500 | |
| Previous Owner | Kitchens Susan R | $124,000 |
Source: Public Records
Tax History Compared to Growth
Tax History
| Year | Tax Paid | Tax Assessment Tax Assessment Total Assessment is a certain percentage of the fair market value that is determined by local assessors to be the total taxable value of land and additions on the property. | Land | Improvement |
|---|---|---|---|---|
| 2025 | $2,290 | $393,500 | $113,300 | $280,200 |
| 2024 | $2,290 | $375,500 | $120,300 | $255,200 |
| 2023 | $1,984 | $319,200 | $102,800 | $216,400 |
| 2022 | $1,925 | $312,400 | $100,800 | $211,600 |
| 2021 | $1,807 | $255,400 | $77,500 | $177,900 |
| 2020 | $1,728 | $223,700 | $72,100 | $151,600 |
| 2019 | $1,648 | $215,200 | $66,400 | $148,800 |
| 2018 | $1,586 | $199,700 | $66,400 | $133,300 |
| 2017 | $1,464 | $187,400 | $66,400 | $121,000 |
| 2016 | $1,324 | $175,100 | $66,400 | $108,700 |
| 2015 | $1,227 | $151,700 | $60,000 | $91,700 |
| 2014 | $1,198 | $145,400 | $58,100 | $87,300 |
Source: Public Records
Map
Nearby Homes
- 5649 Bree St
- 5449 S 3570 W
- 5603 S 4015 W
- 3463 W 5585 S
- 3851 Squire Crest Dr
- 5382 Skeeswood Cir
- 5968 3840 W
- 5476 S 3350 W
- 5331 Queenswood Dr
- 4120 W 5740 S
- 5512 S 3320 W
- 4161 W 5615 S
- 5588 S 4170 W
- 3620 W 5180 S Unit 1 H
- 4207 W 5655 S
- 3588 W Churchwood Dr
- 5161 S 3600 W
- 3536 W Churchwood Dr
- 5116 S 3760 W
- 4243 W 5655 S
- 5587 S Brandy Wine
- 5611 Brandy Wine
- 5587 Brandy Wine
- 5587 S Brandy Wine
- 5623 Brandy Wine
- 5623 S Brandy Wine
- 5604 Brandy Wine
- 5604 S Brandy Wine
- 3764 Shire Cir
- 3756 Dimrall Dr
- 5594 Brandy Wine
- 5635 Brandy Wine
- 5635 S Brandy Wine
- 3762 W Dimrall Dr
- 3762 Dimrall Dr
- 5636 Brandy Wine
- 5636 S Brandy Wine
- 3780 Shire Cir
- 3785 Dimrall Dr
- 3772 Dimrall Dr