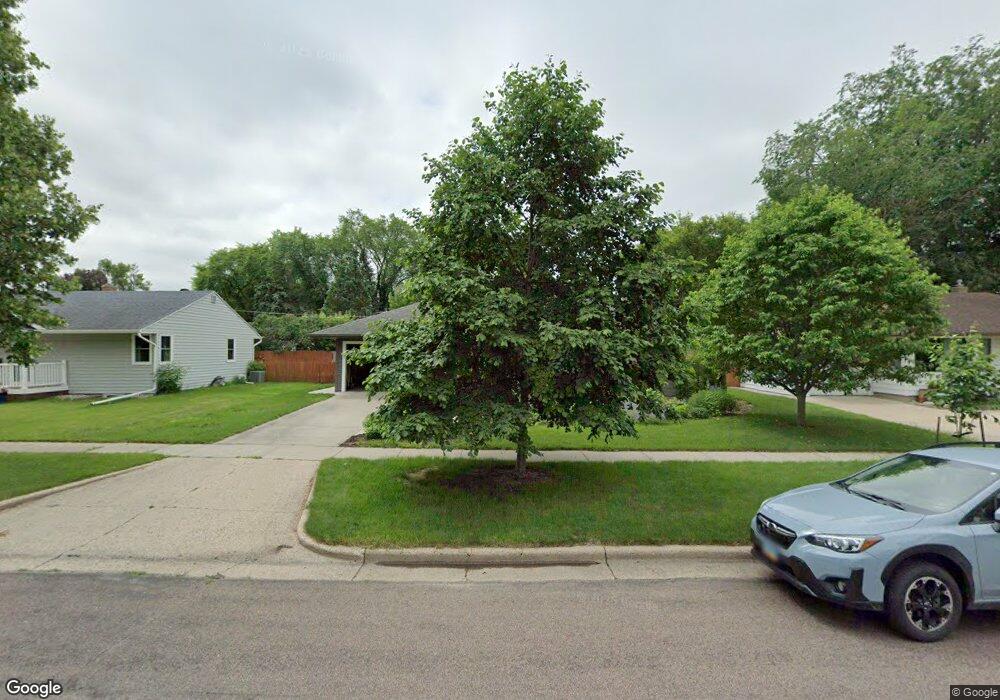
56 17 1 2 Ave N Fargo, ND 58102
Washington NeighborhoodEstimated Value: $246,000 - $305,000
4
Beds
2
Baths
963
Sq Ft
$283/Sq Ft
Est. Value
About This Home
This home is located at 56 17 1 2 Ave N, Fargo, ND 58102 and is currently estimated at $272,822, approximately $283 per square foot. 56 17 1 2 Ave N is a home located in Cass County with nearby schools including Washington Elementary School, Ben Franklin Middle School, and North High School.
Ownership History
Date
Name
Owned For
Owner Type
Purchase Details
Closed on
Jun 21, 2017
Sold by
Leff Mary Ann
Bought by
Kithcart Michael W and Kithcart John G
Current Estimated Value
Purchase Details
Closed on
Sep 19, 2008
Sold by
Carman Joni Irene
Bought by
Leff Mary Ann
Home Financials for this Owner
Home Financials are based on the most recent Mortgage that was taken out on this home.
Original Mortgage
$82,000
Interest Rate
6.52%
Mortgage Type
New Conventional
Purchase Details
Closed on
Sep 8, 2008
Sold by
Muller Michael Henry
Bought by
Leff Mary Ann
Home Financials for this Owner
Home Financials are based on the most recent Mortgage that was taken out on this home.
Original Mortgage
$82,000
Interest Rate
6.52%
Mortgage Type
New Conventional
Purchase Details
Closed on
Aug 27, 2008
Sold by
Leff Mary Ann
Bought by
Carman Joni Irene and Muller Michael Henry
Home Financials for this Owner
Home Financials are based on the most recent Mortgage that was taken out on this home.
Original Mortgage
$82,000
Interest Rate
6.52%
Mortgage Type
New Conventional
Create a Home Valuation Report for This Property
The Home Valuation Report is an in-depth analysis detailing your home's value as well as a comparison with similar homes in the area
Home Values in the Area
Average Home Value in this Area
Purchase History
| Date | Buyer | Sale Price | Title Company |
|---|---|---|---|
| Kithcart Michael W | -- | None Available | |
| Leff Mary Ann | -- | -- | |
| Leff Mary Ann | -- | -- | |
| Leff Mary Ann | -- | -- | |
| Carman Joni Irene | -- | -- |
Source: Public Records
Mortgage History
| Date | Status | Borrower | Loan Amount |
|---|---|---|---|
| Previous Owner | Leff Mary Ann | $82,000 |
Source: Public Records
Tax History Compared to Growth
Tax History
| Year | Tax Paid | Tax Assessment Tax Assessment Total Assessment is a certain percentage of the fair market value that is determined by local assessors to be the total taxable value of land and additions on the property. | Land | Improvement |
|---|---|---|---|---|
| 2024 | $1,764 | $122,950 | $26,650 | $96,300 |
| 2023 | $3,289 | $111,750 | $26,650 | $85,100 |
| 2022 | $3,141 | $104,450 | $26,650 | $77,800 |
| 2021 | $2,927 | $98,550 | $26,650 | $71,900 |
| 2020 | $2,769 | $93,850 | $26,650 | $67,200 |
| 2019 | $2,772 | $93,850 | $14,800 | $79,050 |
| 2018 | $2,351 | $78,900 | $14,800 | $64,100 |
| 2017 | $2,196 | $73,750 | $14,800 | $58,950 |
| 2016 | $1,881 | $67,050 | $14,800 | $52,250 |
| 2015 | $1,987 | $67,050 | $11,100 | $55,950 |
| 2014 | $2,010 | $71,250 | $11,100 | $60,150 |
| 2013 | $1,932 | $63,200 | $11,100 | $52,100 |
Source: Public Records
Map
Nearby Homes
- 111 19th Ave N
- 1633 3rd St N
- 1822 3rd St N
- 314 18th Ave N
- 305 19th Ave N
- 1645 Broadway N
- 3216 Broadway N
- 207 23rd Ave N
- 1626 Broadway N
- 2411 Country Club Pkwy
- 2510 Evergreen Rd N
- 1437 Broadway N Unit 102
- 2512 2nd St N
- 418 25th Ave N
- 1245 1st St N
- 101 27th Ave N
- 1914 9th St N
- 1261 4th St N
- 310 27th Ave N
- 1610 9th St N