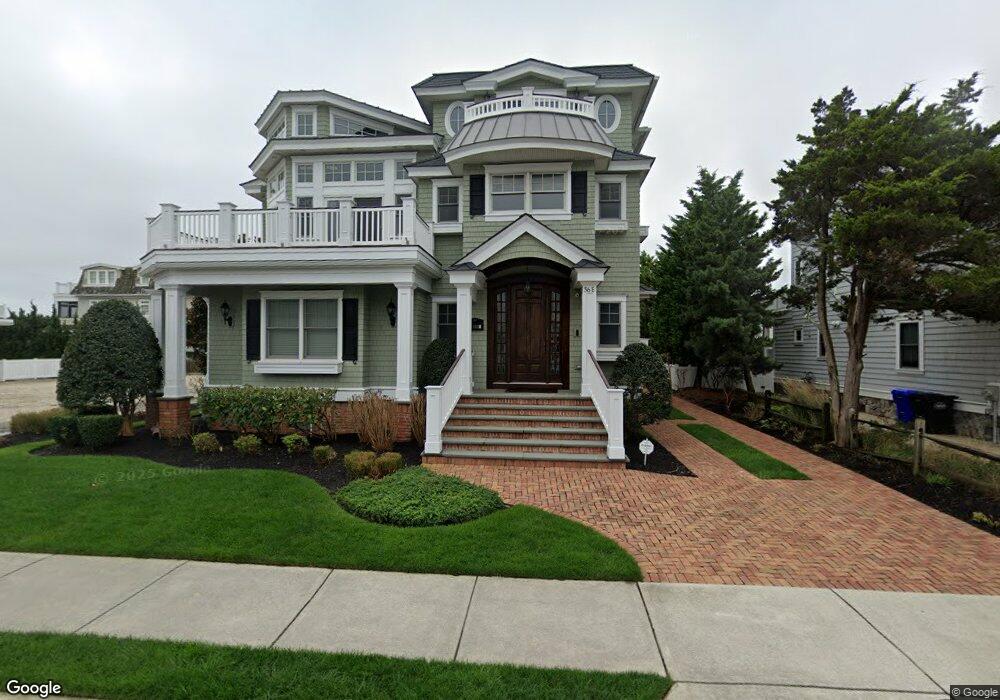
56 26th St E Avalon, NJ 08202
Estimated Value: $4,634,000 - $6,734,000
Studio
--
Bath
4,517
Sq Ft
$1,276/Sq Ft
Est. Value
About This Home
This home is located at 56 26th St E, Avalon, NJ 08202 and is currently estimated at $5,761,688, approximately $1,275 per square foot. 56 26th St E is a home with nearby schools including Avalon Elementary School.
Ownership History
Date
Name
Owned For
Owner Type
Purchase Details
Closed on
Dec 19, 2012
Sold by
Tighe John Thomas and Tighe Mary Grace
Bought by
The Tighe Family Partnership
Current Estimated Value
Purchase Details
Closed on
Feb 5, 2010
Sold by
Pond Samuel H and Pond Maureen M
Bought by
Tighe John Thomas and Tighe Mary Grace
Purchase Details
Closed on
Apr 30, 2007
Sold by
Moriarty John J and Moriarty Nancy H
Bought by
Pond Samuel H and Pond Maureen M
Home Financials for this Owner
Home Financials are based on the most recent Mortgage that was taken out on this home.
Original Mortgage
$1,330,000
Interest Rate
6%
Mortgage Type
Purchase Money Mortgage
Create a Home Valuation Report for This Property
The Home Valuation Report is an in-depth analysis detailing your home's value as well as a comparison with similar homes in the area
Home Values in the Area
Average Home Value in this Area
Purchase History
| Date | Buyer | Sale Price | Title Company |
|---|---|---|---|
| The Tighe Family Partnership | -- | None Available | |
| Tighe John Thomas | $2,125,000 | None Available | |
| Pond Samuel H | $1,990,000 | Shore Title |
Source: Public Records
Mortgage History
| Date | Status | Borrower | Loan Amount |
|---|---|---|---|
| Previous Owner | Pond Samuel H | $1,330,000 |
Source: Public Records
Tax History
| Year | Tax Paid | Tax Assessment Tax Assessment Total Assessment is a certain percentage of the fair market value that is determined by local assessors to be the total taxable value of land and additions on the property. | Land | Improvement |
|---|---|---|---|---|
| 2025 | $21,138 | $3,442,700 | $2,157,500 | $1,285,200 |
| 2024 | $21,138 | $3,442,700 | $2,157,500 | $1,285,200 |
| 2023 | $20,966 | $3,442,700 | $2,157,500 | $1,285,200 |
| 2022 | $19,555 | $3,442,700 | $2,157,500 | $1,285,200 |
| 2021 | $18,832 | $3,442,700 | $2,157,500 | $1,285,200 |
| 2020 | $18,109 | $3,442,700 | $2,157,500 | $1,285,200 |
| 2019 | $17,558 | $3,442,700 | $2,157,500 | $1,285,200 |
| 2018 | $16,800 | $3,442,700 | $2,157,500 | $1,285,200 |
| 2017 | $15,910 | $2,861,500 | $1,720,000 | $1,141,500 |
| 2016 | $15,738 | $2,861,500 | $1,720,000 | $1,141,500 |
| 2015 | $15,481 | $2,861,500 | $1,720,000 | $1,141,500 |
| 2014 | $15,309 | $2,861,500 | $1,720,000 | $1,141,500 |
Source: Public Records
Map
Nearby Homes
- 74 26th St E
- 53 25th St E
- 8 27th St Unit West
- 29 28th St E Unit 7
- 2958 Avalon Ave
- 161 24th St
- 179 27th St
- 118 22nd St
- 76 21st St W
- 174 23rd St
- 2968 First Ave
- 2988 1st Ave
- 212 25th St Unit End Unit
- 25 32nd St W
- 3149 First Ave
- 55 32nd St W Unit C2B
- 55 32nd St W
- 55 32nd St W Unit 1A
- 211 23rd St
- 2023 Dune Dr Unit R6
Your Personal Tour Guide
Ask me questions while you tour the home.