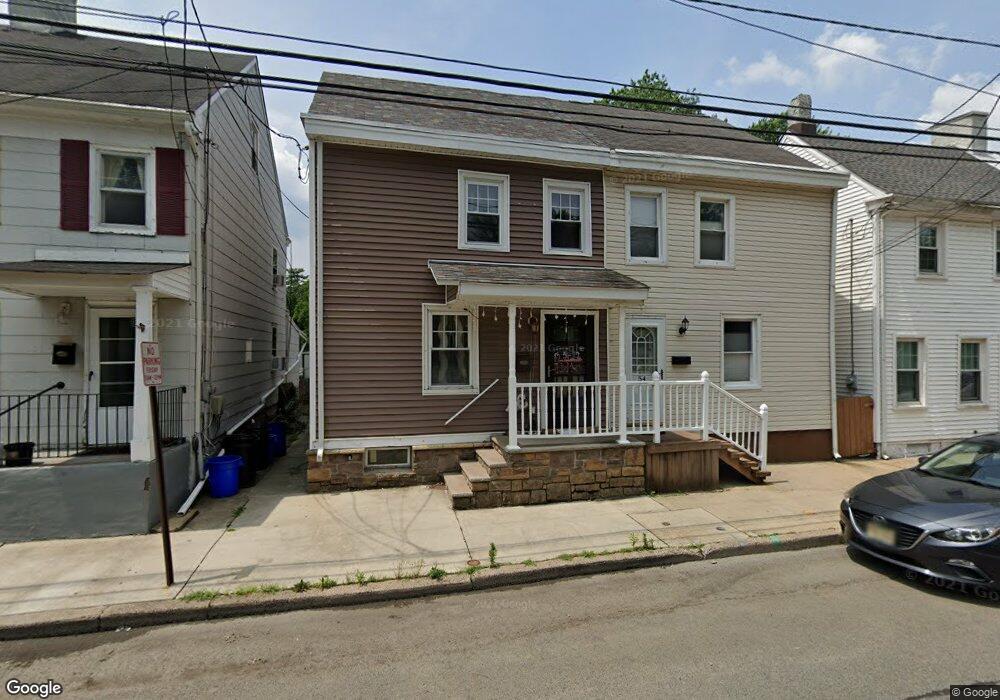
56 2nd St Bordentown, NJ 08505
Estimated Value: $250,000 - $330,000
3
Beds
1
Bath
985
Sq Ft
$302/Sq Ft
Est. Value
About This Home
This home is located at 56 2nd St, Bordentown, NJ 08505 and is currently estimated at $297,208, approximately $301 per square foot. 56 2nd St is a home located in Burlington County with nearby schools including Bordentown Reg High School, St Raphael School, and Meadow View Junior Academy.
Ownership History
Date
Name
Owned For
Owner Type
Purchase Details
Closed on
Jun 13, 2008
Sold by
Ciarrocca Paul
Bought by
Mcgowan Katherine E
Current Estimated Value
Home Financials for this Owner
Home Financials are based on the most recent Mortgage that was taken out on this home.
Original Mortgage
$143,900
Outstanding Balance
$92,151
Interest Rate
6.01%
Mortgage Type
Purchase Money Mortgage
Estimated Equity
$205,057
Purchase Details
Closed on
Mar 13, 2008
Sold by
Winnick Stanley
Bought by
Ciarrocca Paul
Purchase Details
Closed on
Apr 29, 2005
Sold by
Vail Sam W and Vail Heather
Bought by
Winnick Stanley
Home Financials for this Owner
Home Financials are based on the most recent Mortgage that was taken out on this home.
Original Mortgage
$50,400
Interest Rate
5.94%
Mortgage Type
Purchase Money Mortgage
Purchase Details
Closed on
May 25, 2004
Sold by
Kennedy Diana K
Bought by
Vail Sam W and Vail Heather
Create a Home Valuation Report for This Property
The Home Valuation Report is an in-depth analysis detailing your home's value as well as a comparison with similar homes in the area
Home Values in the Area
Average Home Value in this Area
Purchase History
| Date | Buyer | Sale Price | Title Company |
|---|---|---|---|
| Mcgowan Katherine E | $179,900 | None Available | |
| Ciarrocca Paul | $95,000 | Affiliated Title Of South Je | |
| Winnick Stanley | $63,000 | -- | |
| Vail Sam W | $45,500 | Regional Title Agency |
Source: Public Records
Mortgage History
| Date | Status | Borrower | Loan Amount |
|---|---|---|---|
| Open | Mcgowan Katherine E | $143,900 | |
| Previous Owner | Winnick Stanley | $50,400 |
Source: Public Records
Tax History Compared to Growth
Tax History
| Year | Tax Paid | Tax Assessment Tax Assessment Total Assessment is a certain percentage of the fair market value that is determined by local assessors to be the total taxable value of land and additions on the property. | Land | Improvement |
|---|---|---|---|---|
| 2025 | $6,119 | $166,200 | $64,000 | $102,200 |
| 2024 | $5,869 | $166,200 | $64,000 | $102,200 |
| 2023 | $5,869 | $166,200 | $64,000 | $102,200 |
| 2022 | $5,666 | $166,200 | $64,000 | $102,200 |
| 2021 | $5,734 | $166,200 | $64,000 | $102,200 |
| 2020 | $5,777 | $166,200 | $64,000 | $102,200 |
| 2019 | $5,844 | $166,200 | $64,000 | $102,200 |
| 2018 | $5,757 | $166,200 | $64,000 | $102,200 |
| 2017 | $5,589 | $166,200 | $64,000 | $102,200 |
| 2016 | $5,536 | $166,200 | $64,000 | $102,200 |
| 2015 | $5,496 | $166,200 | $64,000 | $102,200 |
| 2014 | $5,234 | $166,200 | $64,000 | $102,200 |
Source: Public Records
Map
Nearby Homes