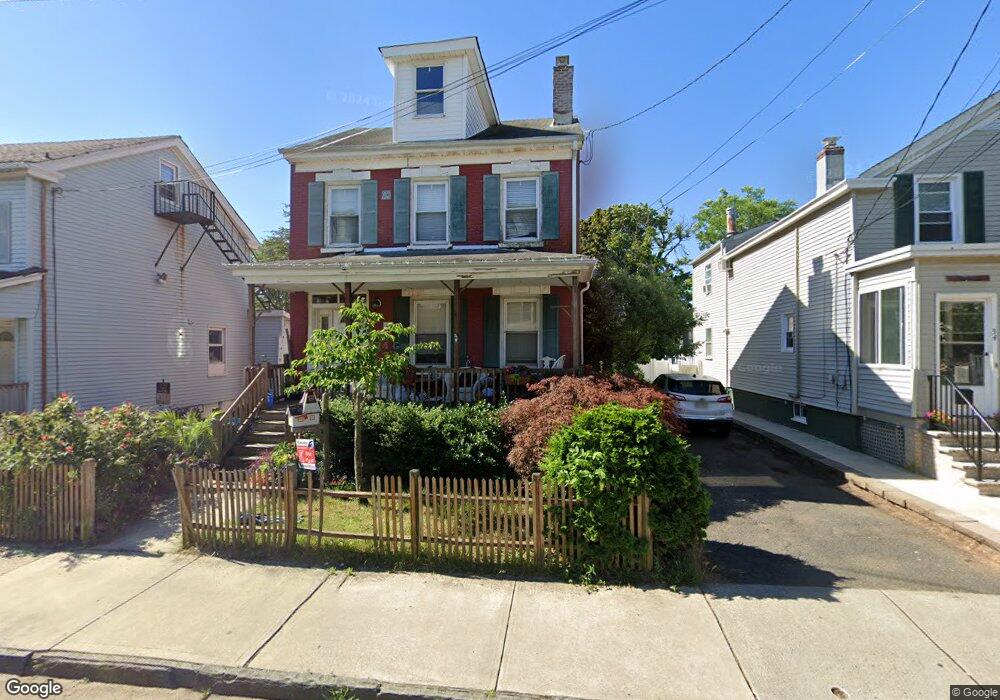
56 2nd St Keyport, NJ 07735
Estimated Value: $504,000 - $651,000
2
Beds
2
Baths
1,837
Sq Ft
$304/Sq Ft
Est. Value
About This Home
This home is located at 56 2nd St, Keyport, NJ 07735 and is currently estimated at $558,442, approximately $303 per square foot. 56 2nd St is a home located in Monmouth County with nearby schools including Keyport Central School, Keyport High School, and Icob Academy.
Ownership History
Date
Name
Owned For
Owner Type
Purchase Details
Closed on
Jul 24, 2006
Sold by
Leswing Richard W
Bought by
Tevis Matthew F and Tevis Jennifer R
Current Estimated Value
Home Financials for this Owner
Home Financials are based on the most recent Mortgage that was taken out on this home.
Original Mortgage
$265,828
Outstanding Balance
$157,990
Interest Rate
6.67%
Mortgage Type
FHA
Estimated Equity
$400,452
Create a Home Valuation Report for This Property
The Home Valuation Report is an in-depth analysis detailing your home's value as well as a comparison with similar homes in the area
Home Values in the Area
Average Home Value in this Area
Purchase History
| Date | Buyer | Sale Price | Title Company |
|---|---|---|---|
| Tevis Matthew F | $270,000 | -- |
Source: Public Records
Mortgage History
| Date | Status | Borrower | Loan Amount |
|---|---|---|---|
| Open | Tevis Matthew F | $265,828 |
Source: Public Records
Tax History Compared to Growth
Tax History
| Year | Tax Paid | Tax Assessment Tax Assessment Total Assessment is a certain percentage of the fair market value that is determined by local assessors to be the total taxable value of land and additions on the property. | Land | Improvement |
|---|---|---|---|---|
| 2025 | $8,651 | $457,900 | $197,300 | $260,600 |
| 2024 | $8,544 | $417,900 | $170,100 | $247,800 |
| 2023 | $8,544 | $388,700 | $154,700 | $234,000 |
| 2022 | $7,726 | $337,900 | $134,500 | $203,400 |
| 2021 | $7,726 | $306,100 | $124,500 | $181,600 |
| 2020 | $7,441 | $292,600 | $119,800 | $172,800 |
| 2019 | $7,213 | $284,100 | $115,300 | $168,800 |
| 2018 | $6,786 | $261,000 | $103,000 | $158,000 |
| 2017 | $6,856 | $263,000 | $107,000 | $156,000 |
| 2016 | $6,594 | $255,100 | $107,000 | $148,100 |
| 2015 | $6,339 | $244,100 | $98,000 | $146,100 |
| 2014 | $5,622 | $218,600 | $73,000 | $145,600 |
Source: Public Records
Map
Nearby Homes