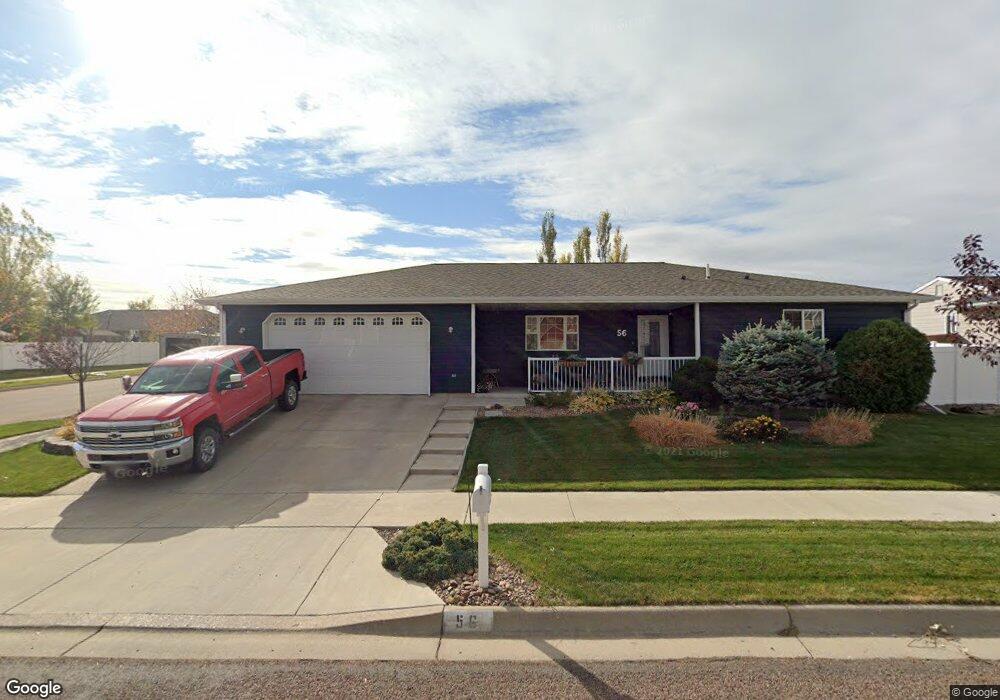
56 33rd Ave NE Great Falls, MT 59404
Estimated Value: $492,000 - $538,000
3
Beds
2
Baths
2,672
Sq Ft
$192/Sq Ft
Est. Value
About This Home
This home is located at 56 33rd Ave NE, Great Falls, MT 59404 and is currently estimated at $513,684, approximately $192 per square foot. 56 33rd Ave NE is a home located in Cascade County with nearby schools including Riverview School, North Middle School, and C.M. Russell High School.
Ownership History
Date
Name
Owned For
Owner Type
Purchase Details
Closed on
May 13, 2015
Sold by
Teilman Halvorson Eva Caroline
Bought by
Teilman Halvorson Christopher Gary
Current Estimated Value
Purchase Details
Closed on
Apr 4, 2014
Sold by
S & L Development Llc
Bought by
Kib Homes Llc
Purchase Details
Closed on
Apr 14, 2008
Sold by
Ayers Darryl W and Ayers Kelly L
Bought by
Ensley Dean E and Ensley Lynn D
Home Financials for this Owner
Home Financials are based on the most recent Mortgage that was taken out on this home.
Original Mortgage
$150,000
Interest Rate
6.22%
Mortgage Type
Purchase Money Mortgage
Purchase Details
Closed on
Nov 29, 2006
Sold by
Birky Karl
Bought by
Ayers Darryl W and Ayers Kelly L
Home Financials for this Owner
Home Financials are based on the most recent Mortgage that was taken out on this home.
Original Mortgage
$166,480
Interest Rate
6.37%
Mortgage Type
New Conventional
Purchase Details
Closed on
Jul 25, 2006
Sold by
Knudson Gary
Bought by
Birky Karl
Create a Home Valuation Report for This Property
The Home Valuation Report is an in-depth analysis detailing your home's value as well as a comparison with similar homes in the area
Purchase History
| Date | Buyer | Sale Price | Title Company |
|---|---|---|---|
| Teilman Halvorson Christopher Gary | -- | None Available | |
| Kib Homes Llc | -- | First American Title Company | |
| Ensley Dean E | -- | Chicago Title Insurance Com | |
| Ayers Darryl W | -- | First American Title Company | |
| Birky Karl | -- | First American Title Company |
Source: Public Records
Mortgage History
| Date | Status | Borrower | Loan Amount |
|---|---|---|---|
| Previous Owner | Ensley Dean E | $150,000 | |
| Previous Owner | Ayers Darryl W | $166,480 |
Source: Public Records
Tax History
| Year | Tax Paid | Tax Assessment Tax Assessment Total Assessment is a certain percentage of the fair market value that is determined by local assessors to be the total taxable value of land and additions on the property. | Land | Improvement |
|---|---|---|---|---|
| 2025 | $3,305 | $487,300 | $0 | $0 |
| 2024 | $3,743 | $384,000 | $0 | $0 |
| 2023 | $3,683 | $384,000 | $0 | $0 |
| 2022 | $3,393 | $317,500 | $0 | $0 |
| 2021 | $3,262 | $317,500 | $0 | $0 |
| 2020 | $3,313 | $300,500 | $0 | $0 |
| 2019 | $3,148 | $300,500 | $0 | $0 |
| 2018 | $2,841 | $265,400 | $0 | $0 |
| 2017 | $2,360 | $265,400 | $0 | $0 |
| 2016 | $2,436 | $257,100 | $0 | $0 |
| 2015 | $2,398 | $257,100 | $0 | $0 |
| 2014 | $2,360 | $130,751 | $0 | $0 |
Source: Public Records
Map
Nearby Homes
- 44 34th Ave NE
- 123 29a Ave NE
- 328 35th Ave NE
- 309 29th Ave NE
- 413 33rd Ave NE
- 3704 4th St NE
- 305 28th Ave NW
- 312 39th Ave NE
- 125 Riverview 5 W
- 212 Riverview 2 E
- 108 41st Ave NE
- 317 39th Ave NE
- 3001 5th St NE
- 505 32nd Ave NE
- 3400 6th St NW
- 209 Choteau Ave NE
- 200 42nd Ave NE
- 213 2nd St NW
- 225 21st Ave NW
- 3702 7th St NE
- 52 33rd Ave NE
- 52 33 Avenue North E
- 57 32nd Ave NE
- 53 32nd Ave NE
- 57 32nd Avenue North E
- 100 33rd Ave NE
- 48 33rd Ave NE
- 57 33rd Ave NE
- 53 33rd Ave NE
- 49 32nd Ave NE
- 101 33rd Ave NE
- 49 32nd Avenue North E
- 104 33rd Ave NE
- 49 33 Avenue North E
- 49 33rd Ave NE
- 105 32nd Ave NE
- 105 32nd Ave NE Unit Great Falls
- 105 32nd Avenue North E
- 45 32nd St N
Your Personal Tour Guide
Ask me questions while you tour the home.