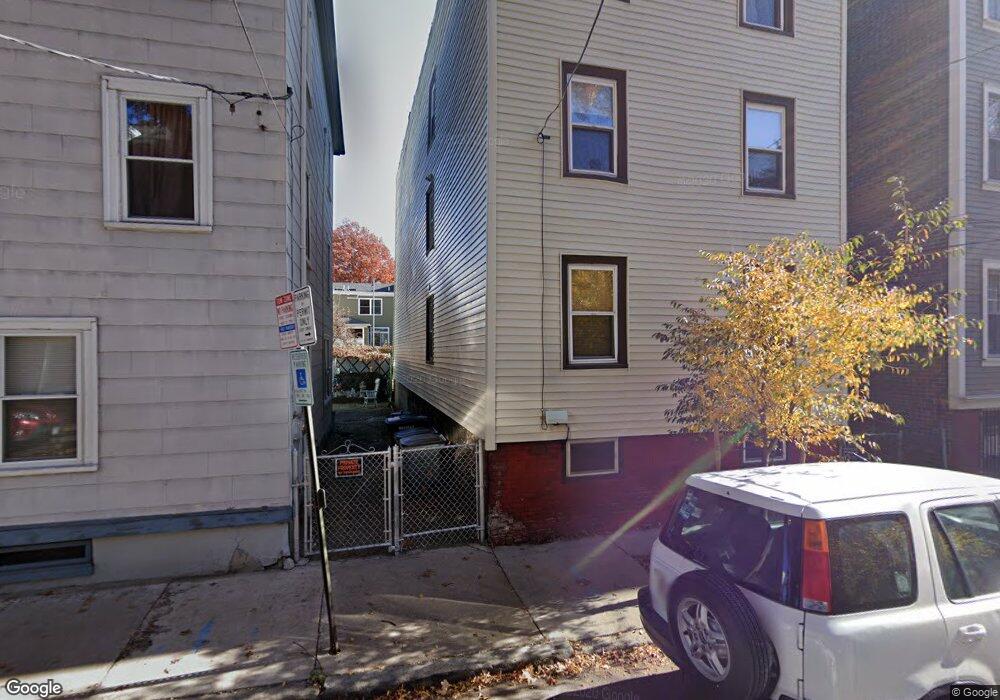
56 7th St Cambridge, MA 02141
East Cambridge NeighborhoodEstimated Value: $1,339,000 - $1,483,000
3
Beds
3
Baths
2,796
Sq Ft
$513/Sq Ft
Est. Value
About This Home
This home is located at 56 7th St, Cambridge, MA 02141 and is currently estimated at $1,433,000, approximately $512 per square foot. 56 7th St is a home located in Middlesex County with nearby schools including Prospect Hill Academy Charter School and Community Charter School of Cambridge.
Ownership History
Date
Name
Owned For
Owner Type
Purchase Details
Closed on
Oct 28, 1998
Sold by
Commonwealth Prop & Dev
Bought by
Chen Wenyong
Current Estimated Value
Home Financials for this Owner
Home Financials are based on the most recent Mortgage that was taken out on this home.
Original Mortgage
$201,000
Interest Rate
6.68%
Mortgage Type
Purchase Money Mortgage
Purchase Details
Closed on
Jul 31, 1998
Sold by
Martins Maria L and Martins Jaime F
Bought by
Commonwealth Prop&Dev
Create a Home Valuation Report for This Property
The Home Valuation Report is an in-depth analysis detailing your home's value as well as a comparison with similar homes in the area
Home Values in the Area
Average Home Value in this Area
Purchase History
| Date | Buyer | Sale Price | Title Company |
|---|---|---|---|
| Chen Wenyong | $185,000 | -- | |
| Commonwealth Prop&Dev | $155,000 | -- | |
| Commonwealth Prop & Dev | $155,000 | -- |
Source: Public Records
Mortgage History
| Date | Status | Borrower | Loan Amount |
|---|---|---|---|
| Open | Commonwealth Prop & Dev | $198,000 | |
| Closed | Commonwealth Prop & Dev | $201,000 |
Source: Public Records
Tax History
| Year | Tax Paid | Tax Assessment Tax Assessment Total Assessment is a certain percentage of the fair market value that is determined by local assessors to be the total taxable value of land and additions on the property. | Land | Improvement |
|---|---|---|---|---|
| 2025 | $7,682 | $1,209,700 | $629,100 | $580,600 |
| 2024 | $7,322 | $1,236,800 | $677,600 | $559,200 |
| 2023 | $6,743 | $1,150,600 | $646,900 | $503,700 |
| 2022 | $6,514 | $1,100,400 | $645,300 | $455,100 |
| 2021 | $6,267 | $1,071,200 | $633,200 | $438,000 |
| 2020 | $6,093 | $1,059,600 | $639,100 | $420,500 |
| 2019 | $6,512 | $1,096,300 | $626,900 | $469,400 |
| 2018 | $6,099 | $944,300 | $519,900 | $424,400 |
| 2017 | $5,629 | $867,400 | $464,800 | $402,600 |
| 2016 | $5,137 | $734,900 | $363,900 | $371,000 |
| 2015 | $4,961 | $634,400 | $311,900 | $322,500 |
| 2014 | $4,499 | $536,900 | $241,600 | $295,300 |
Source: Public Records
Map
Nearby Homes
- 59 7th St
- 59 7th St Unit 2
- 59 7th St Unit 1
- 59 7th St Unit 3
- 47-53R 8th St
- 303 Hurley St
- 747 Cambridge St Unit 7
- 747 Cambridge St Unit 2
- 747 Cambridge St Unit 4
- 747 Cambridge St Unit 6
- 9 Medford St Unit 410
- 9 Medford St Unit 3
- 1 Marney St
- 259 Hurley St Unit 4
- 78 Otis St
- 262 Monsignor Obrien Hwy Unit 503
- 262 Monsignor Obrien Hwy Unit 305
- 764 Cambridge St Unit 6
- 148 Berkshire St Unit 148-4
- 76-78 Thorndike St
Your Personal Tour Guide
Ask me questions while you tour the home.