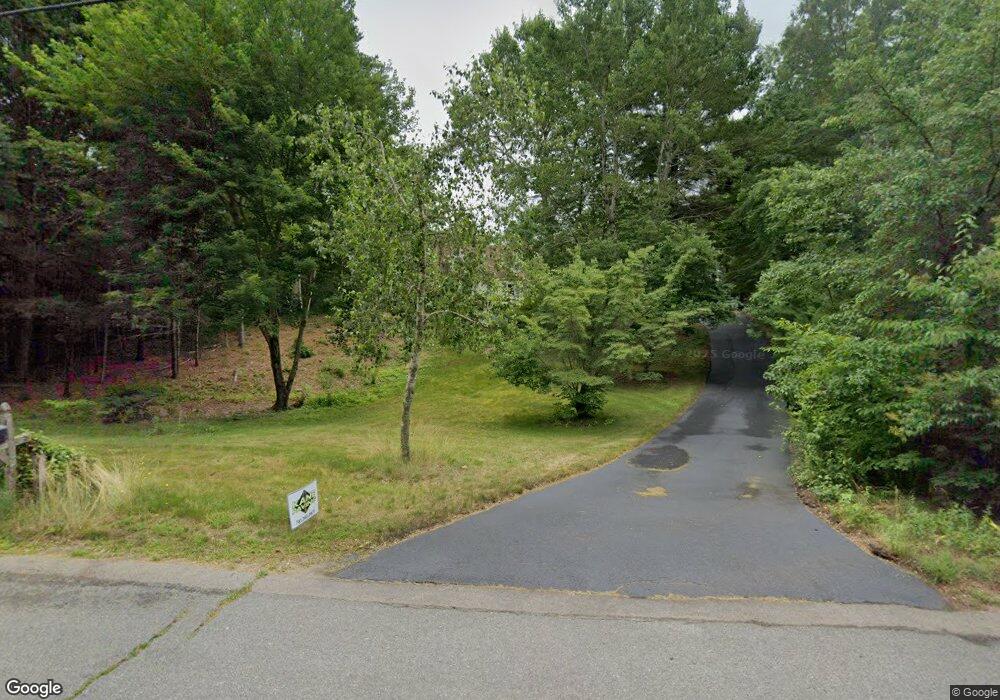
56 Alpine Run Rd Kingston, MA 02364
Estimated Value: $609,274 - $711,000
3
Beds
3
Baths
1,469
Sq Ft
$453/Sq Ft
Est. Value
About This Home
This home is located at 56 Alpine Run Rd, Kingston, MA 02364 and is currently estimated at $665,569, approximately $453 per square foot. 56 Alpine Run Rd is a home located in Plymouth County with nearby schools including Kingston Elementary School, Silver Lake Regional High School, and Kingston Intermediate School.
Ownership History
Date
Name
Owned For
Owner Type
Purchase Details
Closed on
Aug 11, 2000
Sold by
Sullivan James C and Sullivan Elizabeth
Bought by
Teunis Jeremy W and Chen Shu Hui
Current Estimated Value
Purchase Details
Closed on
Nov 6, 1998
Sold by
Benson Julie M
Bought by
Sullivan James C and Sullivan Elizabeth
Purchase Details
Closed on
Oct 23, 1997
Sold by
Thompson Susan L and Thompson James E
Bought by
Benson Julie M
Purchase Details
Closed on
Dec 16, 1992
Sold by
Fed Natl Mtg Assn
Bought by
Caparell Barbara S and Mulhern James M
Purchase Details
Closed on
Aug 24, 1992
Sold by
Camano Alvaro J
Bought by
Huntington Mtg Co
Purchase Details
Closed on
Oct 9, 1990
Sold by
Vonrohr Ests Rt
Bought by
Camano Alvaro J
Create a Home Valuation Report for This Property
The Home Valuation Report is an in-depth analysis detailing your home's value as well as a comparison with similar homes in the area
Home Values in the Area
Average Home Value in this Area
Purchase History
| Date | Buyer | Sale Price | Title Company |
|---|---|---|---|
| Teunis Jeremy W | $243,900 | -- | |
| Sullivan James C | $176,700 | -- | |
| Benson Julie M | $151,700 | -- | |
| Caparell Barbara S | $192,500 | -- | |
| Huntington Mtg Co | $168,000 | -- | |
| Camano Alvaro J | $209,500 | -- |
Source: Public Records
Mortgage History
| Date | Status | Borrower | Loan Amount |
|---|---|---|---|
| Open | Camano Alvaro J | $251,900 | |
| Closed | Camano Alvaro J | $254,100 |
Source: Public Records
Tax History
| Year | Tax Paid | Tax Assessment Tax Assessment Total Assessment is a certain percentage of the fair market value that is determined by local assessors to be the total taxable value of land and additions on the property. | Land | Improvement |
|---|---|---|---|---|
| 2025 | $6,715 | $517,700 | $206,800 | $310,900 |
| 2024 | $6,120 | $481,500 | $179,800 | $301,700 |
| 2023 | $5,881 | $440,200 | $179,800 | $260,400 |
| 2022 | $5,880 | $403,300 | $163,500 | $239,800 |
| 2021 | $3,237 | $366,900 | $163,500 | $203,400 |
| 2020 | $5,789 | $355,600 | $163,500 | $192,100 |
| 2019 | $3,196 | $339,800 | $163,500 | $176,300 |
| 2018 | $3,353 | $314,900 | $163,500 | $151,400 |
| 2017 | $5,023 | $304,400 | $156,300 | $148,100 |
| 2016 | $4,769 | $270,800 | $143,100 | $127,700 |
| 2015 | $4,550 | $268,600 | $143,100 | $125,500 |
| 2014 | $4,445 | $266,500 | $143,100 | $123,400 |
Source: Public Records
Map
Nearby Homes
- 6 Twin Pines Ln Unit 6
- 42 Christmas Tree Ln
- 0 Spring St
- 61 Esta Rd
- 122 High St
- 6 Coachman Terrace
- 13 Pond View Way
- 3 Alec Ln
- 56 Bunnys Rd
- 19 Coachman Terrace
- 1 Pinehurst Dr
- 19 Roosevelt Rd
- 6 Deer Hill Ln
- 14 Mariner's Way Unit 14
- 2 Candlelight Dr
- 44 Mariner's Way Unit 44
- 6 Stone Gate Dr
- 62 Mariners Way Unit 305
- 2 Mariner's Way Unit 306
- 1 Mariner's Way Unit 309
- 60 Alpine Run Rd
- 52 Alpine Run Rd
- 104 Alpine Run Rd
- 55 Alpine Run Rd
- 97 Alpine Run Rd
- 51 Alpine Run Rd
- 59 Alpine Run Rd
- 137 Alpine Run Rd
- 64 Alpine Run Rd
- 43 Alpine Run Rd
- 48 Alpine Run Rd
- 16 Crystal Dr
- 12 Crystal Dr
- 70 Bavarian Way
- 8 Crystal Dr
- 76 Alpine Run Rd
- 20 Crystal Dr
- 66 Bavarian Way
- 68 Alpine Run Rd
- 44 Alpine Run Rd
Your Personal Tour Guide
Ask me questions while you tour the home.