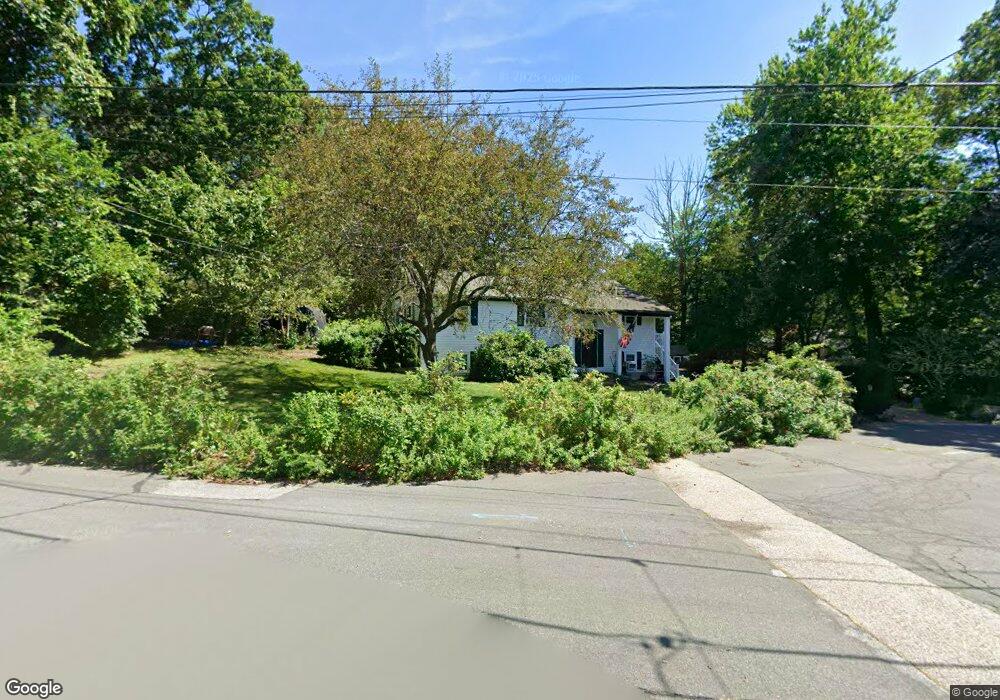
56 Alton Rd North Attleboro, MA 02760
North Attleboro NeighborhoodEstimated Value: $474,000 - $578,000
3
Beds
1
Bath
1,232
Sq Ft
$441/Sq Ft
Est. Value
About This Home
This home is located at 56 Alton Rd, North Attleboro, MA 02760 and is currently estimated at $543,311, approximately $440 per square foot. 56 Alton Rd is a home located in Bristol County with nearby schools including North Attleboro High School and Cadence Academy Preschool - North Attleborough.
Ownership History
Date
Name
Owned For
Owner Type
Purchase Details
Closed on
Aug 24, 2010
Sold by
Burns Gary J and Burns Cynthia J
Bought by
Burns Gary J
Current Estimated Value
Home Financials for this Owner
Home Financials are based on the most recent Mortgage that was taken out on this home.
Original Mortgage
$159,000
Outstanding Balance
$105,683
Interest Rate
4.57%
Estimated Equity
$437,628
Purchase Details
Closed on
Jan 1, 1978
Bought by
Burns Gary J
Create a Home Valuation Report for This Property
The Home Valuation Report is an in-depth analysis detailing your home's value as well as a comparison with similar homes in the area
Home Values in the Area
Average Home Value in this Area
Purchase History
| Date | Buyer | Sale Price | Title Company |
|---|---|---|---|
| Burns Gary J | -- | -- | |
| Burns Gary J | -- | -- |
Source: Public Records
Mortgage History
| Date | Status | Borrower | Loan Amount |
|---|---|---|---|
| Open | Burns Gary J | $159,000 | |
| Closed | Burns Gary J | $33,500 | |
| Previous Owner | Burns Gary J | $45,000 |
Source: Public Records
Tax History Compared to Growth
Tax History
| Year | Tax Paid | Tax Assessment Tax Assessment Total Assessment is a certain percentage of the fair market value that is determined by local assessors to be the total taxable value of land and additions on the property. | Land | Improvement |
|---|---|---|---|---|
| 2025 | $5,803 | $492,200 | $147,900 | $344,300 |
| 2024 | $5,542 | $480,200 | $147,900 | $332,300 |
| 2023 | $5,725 | $447,600 | $147,900 | $299,700 |
| 2022 | $5,495 | $394,500 | $147,900 | $246,600 |
| 2021 | $5,267 | $369,100 | $147,900 | $221,200 |
| 2020 | $5,120 | $356,800 | $147,900 | $208,900 |
| 2019 | $4,964 | $348,600 | $134,400 | $214,200 |
| 2018 | $4,409 | $330,500 | $134,400 | $196,100 |
| 2017 | $4,201 | $317,800 | $134,400 | $183,400 |
| 2016 | $4,089 | $309,300 | $149,200 | $160,100 |
| 2015 | $3,799 | $289,100 | $149,200 | $139,900 |
| 2014 | $3,624 | $273,700 | $131,100 | $142,600 |
Source: Public Records
Map
Nearby Homes
- 34 Hawthorne St
- 64 Smith St
- 35-R Whiting St
- 2 Franklin Ave
- 835 Mt Hope St Unit 39
- 271 N Washington St
- 194 Smith St
- 157 Fisher St
- 45 Moran St
- 39 Columbia St
- 12 Houde St
- 633 E Washington St Unit 17
- 0 Landry 2nd Unit 73350867
- 105 East St
- Lot 5 Jeffrey Dr
- Lot 2 Jeffrey Dr
- 711 Mount Hope St Unit 13
- 711 Mount Hope St Unit 8
- 711 Mount Hope St Unit 11
- 711 Mount Hope St Unit 12