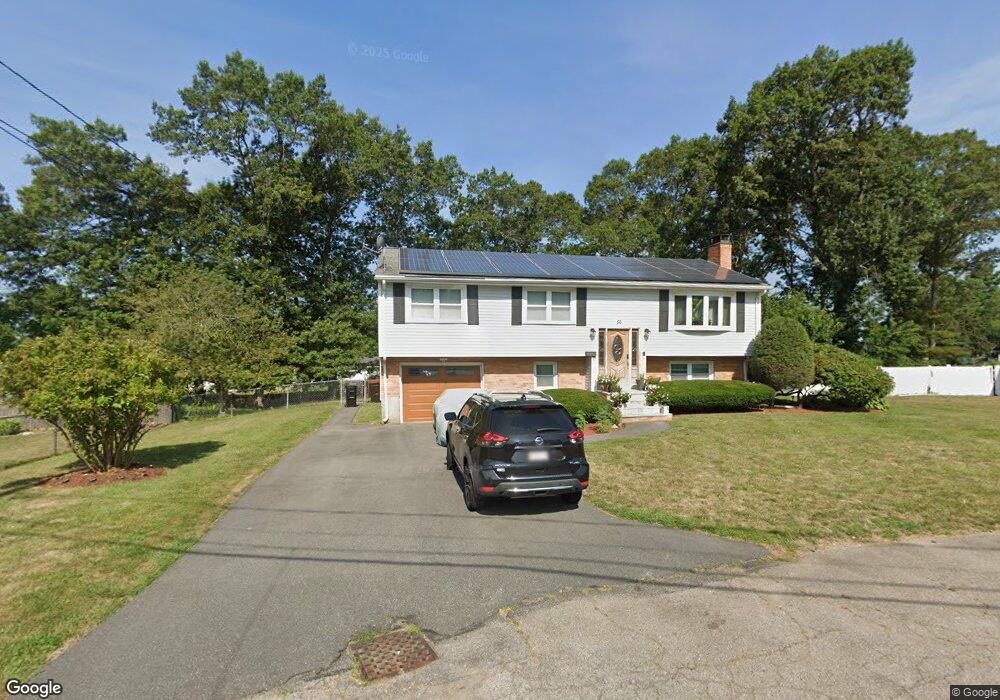
56 Baltic Ave Brockton, MA 02302
Montello NeighborhoodEstimated Value: $523,000 - $605,000
3
Beds
2
Baths
1,196
Sq Ft
$484/Sq Ft
Est. Value
About This Home
This home is located at 56 Baltic Ave, Brockton, MA 02302 and is currently estimated at $578,473, approximately $483 per square foot. 56 Baltic Ave is a home located in Plymouth County with nearby schools including Brookfield Elementary School, Mary E. Baker Elementary School, and Downey Elementary School.
Ownership History
Date
Name
Owned For
Owner Type
Purchase Details
Closed on
Feb 13, 2008
Sold by
Structured Asset Mtg I
Bought by
Halliday Jacqueline
Current Estimated Value
Home Financials for this Owner
Home Financials are based on the most recent Mortgage that was taken out on this home.
Original Mortgage
$212,000
Outstanding Balance
$134,282
Interest Rate
6.14%
Mortgage Type
Purchase Money Mortgage
Estimated Equity
$444,191
Purchase Details
Closed on
Jan 30, 2008
Sold by
Coleman James L
Bought by
Bank Of New York
Home Financials for this Owner
Home Financials are based on the most recent Mortgage that was taken out on this home.
Original Mortgage
$212,000
Outstanding Balance
$134,282
Interest Rate
6.14%
Mortgage Type
Purchase Money Mortgage
Estimated Equity
$444,191
Purchase Details
Closed on
Sep 14, 2004
Sold by
Moncevicz William D
Bought by
Coleman James L
Create a Home Valuation Report for This Property
The Home Valuation Report is an in-depth analysis detailing your home's value as well as a comparison with similar homes in the area
Home Values in the Area
Average Home Value in this Area
Purchase History
| Date | Buyer | Sale Price | Title Company |
|---|---|---|---|
| Halliday Jacqueline | $265,000 | -- | |
| Bank Of New York | $289,109 | -- | |
| Coleman James L | $315,000 | -- |
Source: Public Records
Mortgage History
| Date | Status | Borrower | Loan Amount |
|---|---|---|---|
| Open | Coleman James L | $212,000 | |
| Closed | Coleman James L | $45,000 |
Source: Public Records
Tax History Compared to Growth
Tax History
| Year | Tax Paid | Tax Assessment Tax Assessment Total Assessment is a certain percentage of the fair market value that is determined by local assessors to be the total taxable value of land and additions on the property. | Land | Improvement |
|---|---|---|---|---|
| 2025 | $6,277 | $518,300 | $158,800 | $359,500 |
| 2024 | $6,145 | $511,200 | $158,800 | $352,400 |
| 2023 | $5,687 | $438,100 | $124,700 | $313,400 |
| 2022 | $5,242 | $375,200 | $113,800 | $261,400 |
| 2021 | $5,308 | $366,100 | $103,800 | $262,300 |
| 2020 | $5,136 | $339,000 | $99,400 | $239,600 |
| 2019 | $4,632 | $298,100 | $92,600 | $205,500 |
| 2018 | $5,044 | $314,100 | $92,600 | $221,500 |
| 2017 | $4,352 | $270,300 | $92,600 | $177,700 |
| 2016 | $4,253 | $245,000 | $89,100 | $155,900 |
| 2015 | $4,042 | $222,700 | $89,100 | $133,600 |
| 2014 | $3,992 | $220,200 | $89,100 | $131,100 |
Source: Public Records
Map
Nearby Homes