56 Bates Rd Westfield, MA 01085
Westfield AreaEstimated Value: $366,000 - $418,000
About This Home
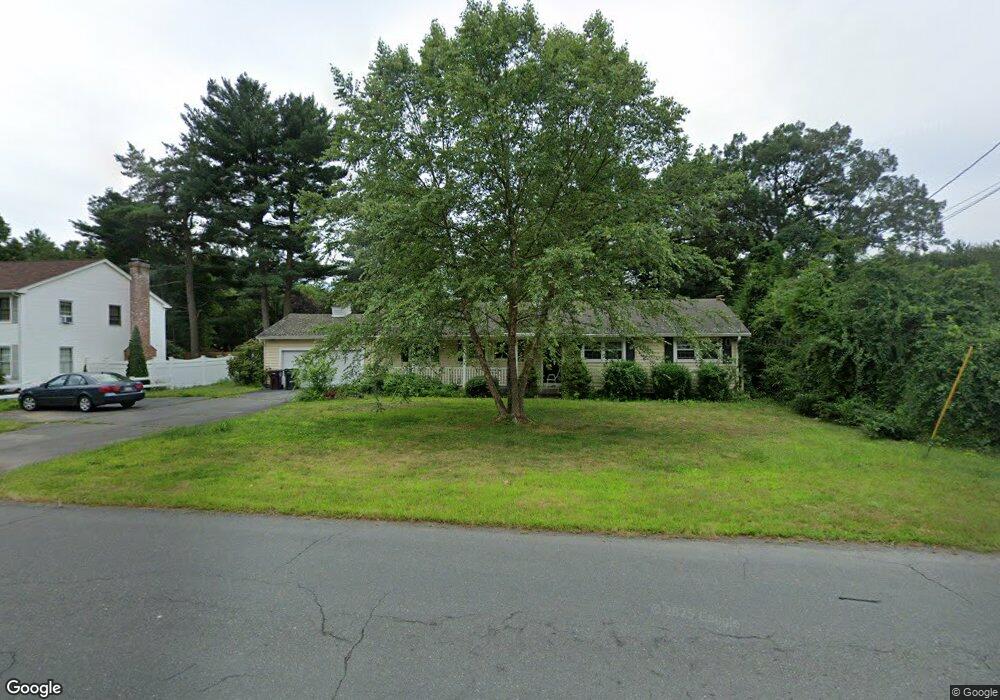
This home is located at 56 Bates Rd, Westfield, MA 01085 and is currently estimated at $399,711, approximately $272 per square foot. 56 Bates Rd is a home located in Hampden County with nearby schools including Westfield High School and Saint Mary High School.
Ownership History
We collect this data history from publicly available records. To have your information removed, we recommend requesting removal directly through your county’s website.
Purchase Details
Home Values in the Area
Average Home Value in this Area
Purchase History
We collect this data history from publicly available records. To have your information removed, we recommend requesting removal directly through your county’s website.
| Date | Buyer | Sale Price | Title Company |
|---|---|---|---|
| -- | -- | ||
| $215,000 | -- |
Mortgage History
We collect this data history from publicly available records. To have your information removed, we recommend requesting removal directly through your county’s website.
| Date | Status | Borrower | Loan Amount |
|---|---|---|---|
| Open | $147,000 | ||
| Closed | $50,000 |
Tax History
We collect this data history from publicly available records. To have your information removed, we recommend requesting removal directly through your county’s website.
| Year | Tax Paid | Tax Assessment Tax Assessment Total Assessment is a certain percentage of the fair market value that is determined by local assessors to be the total taxable value of land and additions on the property. | Land | Improvement |
|---|---|---|---|---|
| 2025 | $5,000 | $329,400 | $127,400 | $202,000 |
| 2024 | $5,074 | $317,700 | $115,700 | $202,000 |
| 2023 | $5,449 | $287,600 | $110,400 | $177,200 |
| 2022 | $4,715 | $255,000 | $98,400 | $156,600 |
| 2021 | $3,220 | $241,800 | $92,800 | $149,000 |
| 2020 | $4,439 | $230,600 | $92,800 | $137,800 |
| 2019 | $4,343 | $220,800 | $88,600 | $132,200 |
| 2018 | $5,637 | $220,800 | $88,600 | $132,200 |
| 2017 | $4,199 | $216,200 | $89,700 | $126,500 |
| 2016 | $4,203 | $216,200 | $89,700 | $126,500 |
| 2015 | $4,008 | $216,200 | $89,700 | $126,500 |
| 2014 | $2,998 | $216,200 | $89,700 | $126,500 |
Map
- 555 Russell Rd Unit J-65
- 472 Russell Rd
- 460 Russell Rd
- 1430 Russell Rd Unit 12
- 0 Honey Pot Rd
- 12 Woodland Rd
- 324 Russell Rd Unit 109
- 165 Western Ave
- 32 Spruce St
- 291 Pochassic Rd
- 41 Pinewood Ln
- 180 Loomis Ridge
- 89 Kane Brothers Cir
- 183 Loomis Ridge
- 183 Loomis Ridge Rd
- 0 Woodland Way
- 45 Skyline Dr
- 570 Woodland Way
- 15 Kenwood St
- 705 General Knox Rd
Ask me questions while you tour the home.