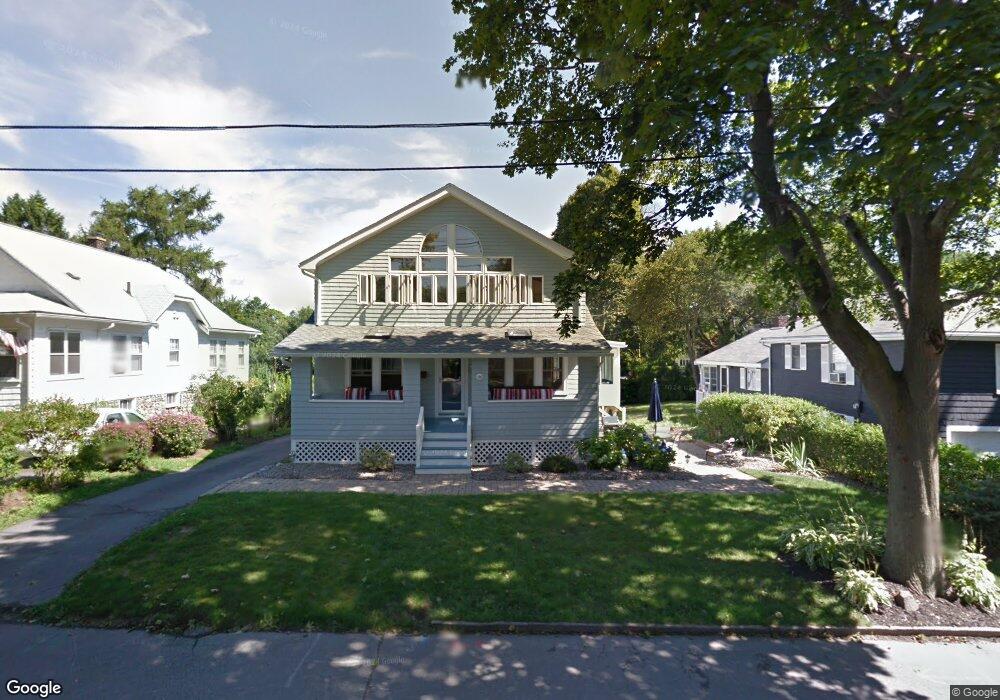
56 Beach St Marblehead, MA 01945
Estimated Value: $1,246,300 - $1,485,000
3
Beds
2
Baths
2,700
Sq Ft
$504/Sq Ft
Est. Value
About This Home
This home is located at 56 Beach St, Marblehead, MA 01945 and is currently estimated at $1,359,825, approximately $503 per square foot. 56 Beach St is a home located in Essex County with nearby schools including Marblehead High School, Marblehead Community Charter Public School, and Devereux School.
Ownership History
Date
Name
Owned For
Owner Type
Purchase Details
Closed on
Apr 18, 2025
Sold by
Adam Ft and Adam
Bought by
Adam Christopher J and Adam Lisa M
Current Estimated Value
Purchase Details
Closed on
Aug 14, 2019
Sold by
Adam Christopher J
Bought by
Adam Ft
Purchase Details
Closed on
Aug 31, 2010
Sold by
Jalbert Marc R and Jalbert Kim M
Bought by
Adam Christopher J
Home Financials for this Owner
Home Financials are based on the most recent Mortgage that was taken out on this home.
Original Mortgage
$155,000
Interest Rate
4.57%
Mortgage Type
Purchase Money Mortgage
Purchase Details
Closed on
Oct 3, 2006
Sold by
Mclean Maryellen
Bought by
Jalbert Marc R
Purchase Details
Closed on
Mar 31, 2005
Sold by
Benson Damien C
Bought by
Mclean Mary Ellen
Create a Home Valuation Report for This Property
The Home Valuation Report is an in-depth analysis detailing your home's value as well as a comparison with similar homes in the area
Home Values in the Area
Average Home Value in this Area
Purchase History
| Date | Buyer | Sale Price | Title Company |
|---|---|---|---|
| Adam Christopher J | -- | None Available | |
| Adam Christopher J | -- | None Available | |
| Adam Christopher J | -- | None Available | |
| Adam Ft | -- | -- | |
| Adam Christopher J | $600,000 | -- | |
| Adam Christopher J | $600,000 | -- | |
| Jalbert Marc R | $690,000 | -- | |
| Jalbert Marc R | $690,000 | -- | |
| Mclean Mary Ellen | $263,120 | -- | |
| Mclean Mary Ellen | $263,120 | -- |
Source: Public Records
Mortgage History
| Date | Status | Borrower | Loan Amount |
|---|---|---|---|
| Previous Owner | Mclean Mary Ellen | $315,000 | |
| Previous Owner | Mclean Mary Ellen | $155,000 |
Source: Public Records
Tax History
| Year | Tax Paid | Tax Assessment Tax Assessment Total Assessment is a certain percentage of the fair market value that is determined by local assessors to be the total taxable value of land and additions on the property. | Land | Improvement |
|---|---|---|---|---|
| 2025 | $10,352 | $1,143,900 | $792,300 | $351,600 |
| 2024 | $10,733 | $1,197,900 | $853,300 | $344,600 |
| 2023 | $8,804 | $880,400 | $597,300 | $283,100 |
| 2022 | $8,778 | $834,400 | $560,700 | $273,700 |
| 2021 | $8,670 | $832,100 | $560,700 | $271,400 |
| 2020 | $7,996 | $769,600 | $524,100 | $245,500 |
| 2019 | $7,480 | $696,500 | $451,000 | $245,500 |
| 2018 | $7,608 | $690,400 | $444,900 | $245,500 |
| 2017 | $7,534 | $684,300 | $438,800 | $245,500 |
| 2016 | $7,325 | $659,900 | $414,400 | $245,500 |
| 2015 | $6,502 | $586,800 | $341,300 | $245,500 |
| 2014 | $5,890 | $531,100 | $292,500 | $238,600 |
Source: Public Records
Map
Nearby Homes
- 23 Wyman Rd
- 4 Gallison Ave
- 282 Pleasant St
- 290 Washington St Unit A
- 55 Brackett Place Unit B
- 70 Maverick St
- 30 Haley Rd Unit 1
- 6 Mount Vernon St
- 66 Pleasant St Unit 1
- 66 Pleasant St Unit 2
- 26 Summer St Unit 1
- 132 Elm St
- 132 Elm St Unit 132
- 45 Pleasant St
- 9 Darling St
- 4 Dean Rd
- 3 Frost Ln Unit 1
- 7 Mechanic Ct
- 12 Pickwick Rd
- 1 Knollwood Rd
Your Personal Tour Guide
Ask me questions while you tour the home.