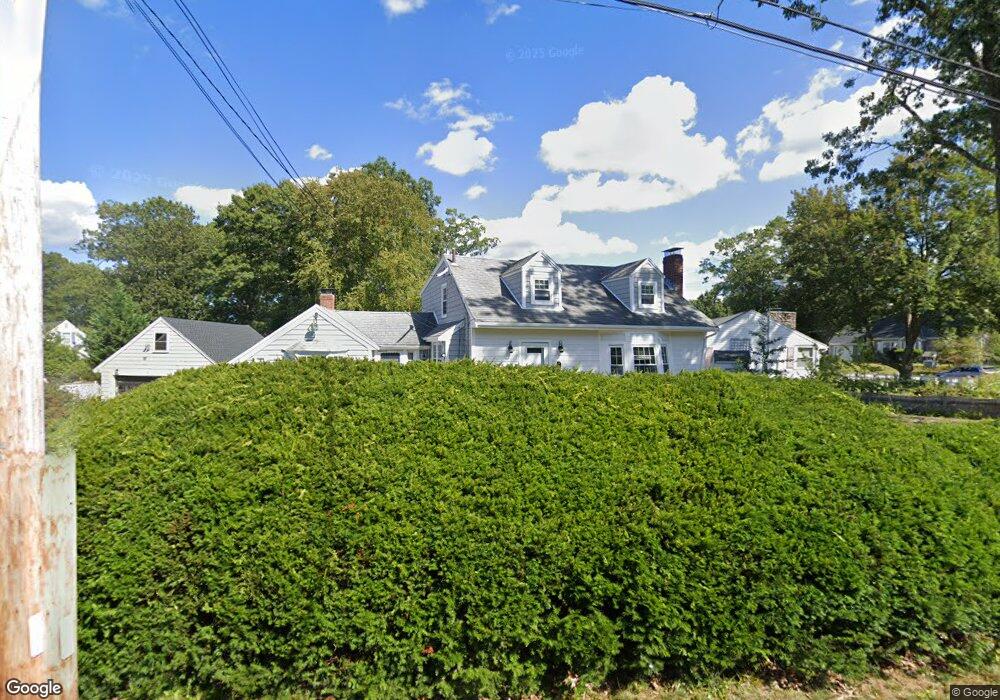
56 Belmont St Weymouth, MA 02188
South Weymouth NeighborhoodEstimated Value: $664,830 - $776,000
4
Beds
2
Baths
1,841
Sq Ft
$395/Sq Ft
Est. Value
About This Home
This home is located at 56 Belmont St, Weymouth, MA 02188 and is currently estimated at $726,708, approximately $394 per square foot. 56 Belmont St is a home located in Norfolk County with nearby schools including Frederick C Murphy, Abigail Adams Middle School, and Weymouth Middle School Chapman.
Ownership History
Date
Name
Owned For
Owner Type
Purchase Details
Closed on
Apr 28, 2000
Sold by
Turner Frederick D and Turner Karla A
Bought by
Dossett Peter D and Dossett Alyson J
Current Estimated Value
Home Financials for this Owner
Home Financials are based on the most recent Mortgage that was taken out on this home.
Original Mortgage
$189,900
Outstanding Balance
$66,030
Interest Rate
8.23%
Mortgage Type
Purchase Money Mortgage
Estimated Equity
$660,678
Create a Home Valuation Report for This Property
The Home Valuation Report is an in-depth analysis detailing your home's value as well as a comparison with similar homes in the area
Home Values in the Area
Average Home Value in this Area
Purchase History
| Date | Buyer | Sale Price | Title Company |
|---|---|---|---|
| Dossett Peter D | $239,900 | -- |
Source: Public Records
Mortgage History
| Date | Status | Borrower | Loan Amount |
|---|---|---|---|
| Open | Dossett Peter D | $189,900 | |
| Previous Owner | Dossett Peter D | $112,500 |
Source: Public Records
Tax History Compared to Growth
Tax History
| Year | Tax Paid | Tax Assessment Tax Assessment Total Assessment is a certain percentage of the fair market value that is determined by local assessors to be the total taxable value of land and additions on the property. | Land | Improvement |
|---|---|---|---|---|
| 2025 | $5,589 | $553,400 | $242,100 | $311,300 |
| 2024 | $5,413 | $527,100 | $230,600 | $296,500 |
| 2023 | $5,212 | $498,800 | $213,500 | $285,300 |
| 2022 | $4,900 | $427,600 | $181,300 | $246,300 |
| 2021 | $4,719 | $402,000 | $181,300 | $220,700 |
| 2020 | $4,602 | $386,100 | $181,300 | $204,800 |
| 2019 | $4,489 | $370,400 | $174,300 | $196,100 |
| 2018 | $4,421 | $353,700 | $166,000 | $187,700 |
| 2017 | $4,275 | $333,700 | $158,100 | $175,600 |
| 2016 | $4,108 | $320,900 | $152,000 | $168,900 |
| 2015 | $3,885 | $301,200 | $145,100 | $156,100 |
| 2014 | $3,642 | $273,800 | $135,000 | $138,800 |
Source: Public Records
Map
Nearby Homes
- 116 Belmont St
- 501 Commerce Dr Unit 2310
- 501 Commerce Dr Unit 1111
- 501 Commerce Dr Unit 4206
- 501 Commerce Dr Unit 4308
- 501 Commerce Dr Unit 4306
- 655 Summer St
- 255 West St
- 262 West St
- 200 Justin Dr Unit 3
- 92 Mercury St
- 432 Grove St
- 441 Grove St
- 972 Liberty St
- 308 Forest St
- 48 Apple Tree Ln
- 67 Abby Rd
- 16 Jay Rd
- 2 Tara Dr Unit 1
- 54 Federal St