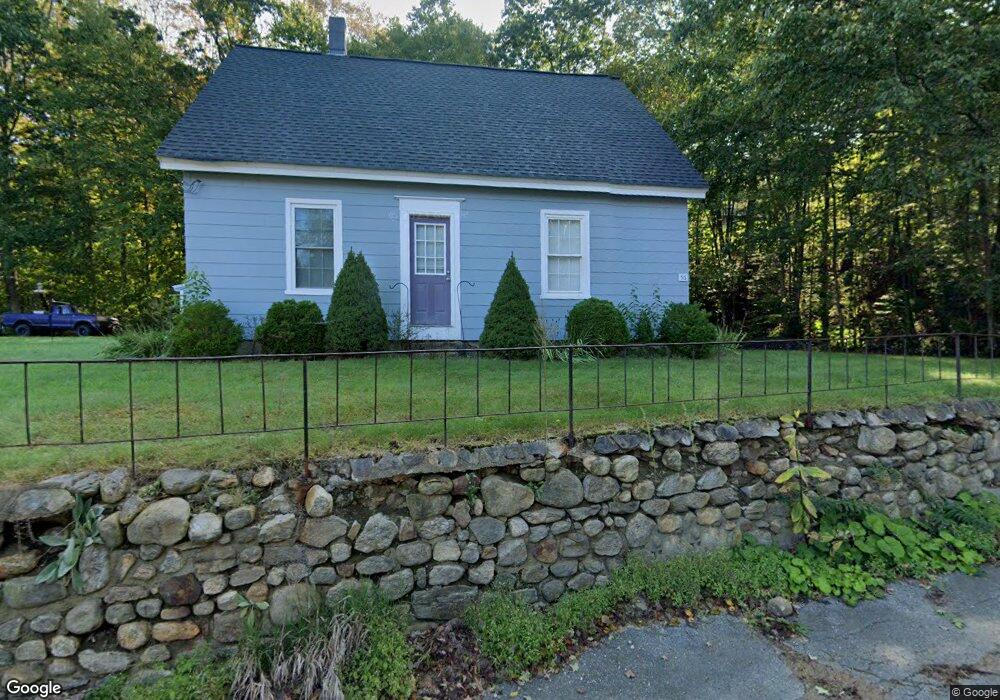
56 Bigelow St North Brookfield, MA 01535
Estimated Value: $318,000 - $351,000
3
Beds
2
Baths
1,256
Sq Ft
$265/Sq Ft
Est. Value
About This Home
This home is located at 56 Bigelow St, North Brookfield, MA 01535 and is currently estimated at $333,202, approximately $265 per square foot. 56 Bigelow St is a home located in Worcester County with nearby schools including North Brookfield Elementary School and North Brookfield High School.
Ownership History
Date
Name
Owned For
Owner Type
Purchase Details
Closed on
Apr 25, 2002
Sold by
Buzzell Rose M
Bought by
Lalashius Christopher and Lalashius Denise R
Current Estimated Value
Home Financials for this Owner
Home Financials are based on the most recent Mortgage that was taken out on this home.
Original Mortgage
$127,300
Outstanding Balance
$53,675
Interest Rate
7.05%
Mortgage Type
Purchase Money Mortgage
Estimated Equity
$279,527
Create a Home Valuation Report for This Property
The Home Valuation Report is an in-depth analysis detailing your home's value as well as a comparison with similar homes in the area
Home Values in the Area
Average Home Value in this Area
Purchase History
| Date | Buyer | Sale Price | Title Company |
|---|---|---|---|
| Lalashius Christopher | $134,000 | -- |
Source: Public Records
Mortgage History
| Date | Status | Borrower | Loan Amount |
|---|---|---|---|
| Open | Lalashius Christopher | $127,300 | |
| Previous Owner | Lalashius Christopher | $100,000 | |
| Previous Owner | Lalashius Christopher | $75,000 |
Source: Public Records
Tax History Compared to Growth
Tax History
| Year | Tax Paid | Tax Assessment Tax Assessment Total Assessment is a certain percentage of the fair market value that is determined by local assessors to be the total taxable value of land and additions on the property. | Land | Improvement |
|---|---|---|---|---|
| 2025 | $3,090 | $218,100 | $65,600 | $152,500 |
| 2024 | $2,860 | $217,800 | $64,900 | $152,900 |
| 2023 | $2,697 | $201,900 | $58,900 | $143,000 |
| 2022 | $2,572 | $173,100 | $48,800 | $124,300 |
| 2021 | $2,468 | $156,800 | $47,400 | $109,400 |
| 2019 | $2,421 | $142,600 | $47,900 | $94,700 |
| 2018 | $2,501 | $150,000 | $47,900 | $102,100 |
| 2017 | $2,471 | $149,500 | $59,900 | $89,600 |
| 2016 | $2,419 | $149,500 | $59,900 | $89,600 |
| 2015 | $2,351 | $150,800 | $61,200 | $89,600 |
| 2014 | $2,298 | $150,800 | $61,200 | $89,600 |
Source: Public Records
Map
Nearby Homes
- 38 Mount Pleasant St
- 61 Bates St
- 48 Mill Rd Lot 2e
- 12 Cushing St
- 326 N Main St
- 39 Forest St
- 8 Elm St
- 60 Gilbert St
- 101 School St
- 18-20 Old w Brookfield Rd
- 10 Rufus Putnam Rd
- 4 E Brookfield Rd
- 157 School St
- 10 Brookfield Rd
- 8 Walker Rd
- 3 Town Farm Rd
- 30 Town Farm Rd
- 11 Brickyard Rd
- 179 Pierce Rd
- 7 Church Street Extension