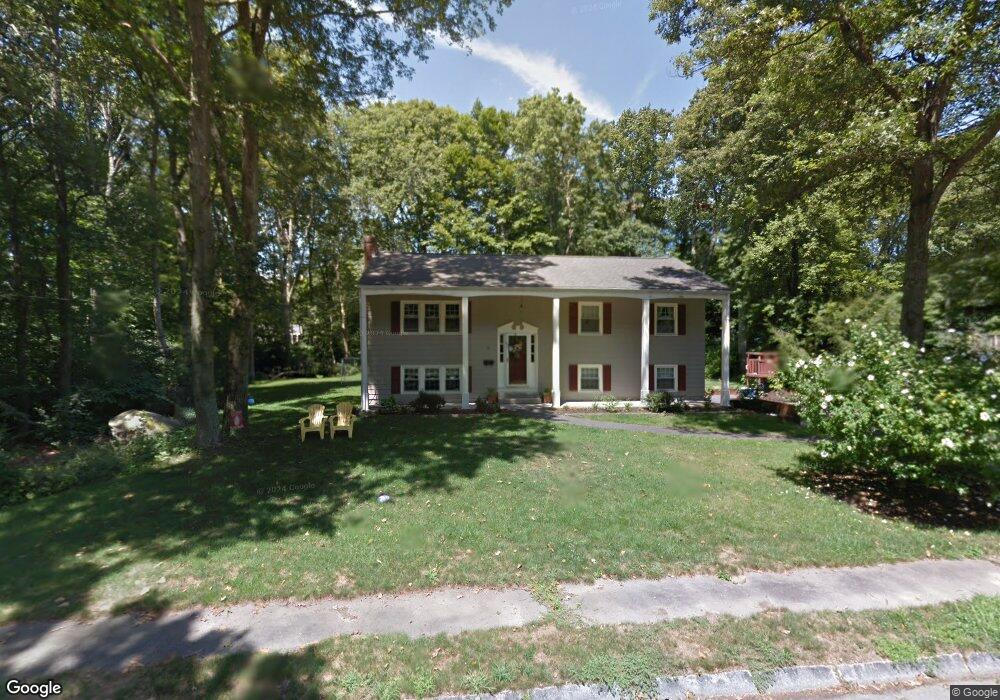
56 Borrows Rd Foxboro, MA 02035
Estimated Value: $684,681 - $773,000
4
Beds
2
Baths
2,600
Sq Ft
$282/Sq Ft
Est. Value
About This Home
This home is located at 56 Borrows Rd, Foxboro, MA 02035 and is currently estimated at $734,170, approximately $282 per square foot. 56 Borrows Rd is a home located in Norfolk County with nearby schools including Foxborough High School, Discovery Daycare Center, and Hands-On-Montessori School.
Ownership History
Date
Name
Owned For
Owner Type
Purchase Details
Closed on
Jun 27, 2008
Sold by
Steele Ronald J and Steele Charlene A
Bought by
Boudreau Erin E and Boudreau Edward C
Current Estimated Value
Home Financials for this Owner
Home Financials are based on the most recent Mortgage that was taken out on this home.
Original Mortgage
$267,000
Interest Rate
6.07%
Mortgage Type
Purchase Money Mortgage
Purchase Details
Closed on
Apr 13, 1990
Sold by
Finnell Francis A
Bought by
Steele Ronald J
Create a Home Valuation Report for This Property
The Home Valuation Report is an in-depth analysis detailing your home's value as well as a comparison with similar homes in the area
Home Values in the Area
Average Home Value in this Area
Purchase History
| Date | Buyer | Sale Price | Title Company |
|---|---|---|---|
| Boudreau Erin E | $395,000 | -- | |
| Steele Ronald J | $162,500 | -- |
Source: Public Records
Mortgage History
| Date | Status | Borrower | Loan Amount |
|---|---|---|---|
| Open | Steele Ronald J | $270,500 | |
| Closed | Boudreau Erin E | $267,000 | |
| Previous Owner | Steele Ronald J | $260,000 | |
| Previous Owner | Steele Ronald J | $31,000 |
Source: Public Records
Tax History
| Year | Tax Paid | Tax Assessment Tax Assessment Total Assessment is a certain percentage of the fair market value that is determined by local assessors to be the total taxable value of land and additions on the property. | Land | Improvement |
|---|---|---|---|---|
| 2025 | $7,773 | $588,000 | $247,500 | $340,500 |
| 2024 | $7,499 | $555,100 | $252,000 | $303,100 |
| 2023 | $7,271 | $511,700 | $239,900 | $271,800 |
| 2022 | $6,612 | $455,400 | $201,100 | $254,300 |
| 2021 | $6,150 | $417,200 | $186,200 | $231,000 |
| 2020 | $5,720 | $392,600 | $186,200 | $206,400 |
| 2019 | $5,623 | $382,500 | $177,400 | $205,100 |
| 2018 | $5,470 | $375,400 | $177,400 | $198,000 |
| 2017 | $5,308 | $352,900 | $165,800 | $187,100 |
| 2016 | $5,383 | $363,200 | $167,200 | $196,000 |
| 2015 | $5,180 | $341,000 | $141,400 | $199,600 |
| 2014 | $4,972 | $331,700 | $132,100 | $199,600 |
Source: Public Records
Map
Nearby Homes
- 128 Tremont St
- 346 South St
- 1769 West St
- 24 Maverick Dr
- 40 Treasure Island Rd
- 16 Treasure Island Rd
- 85 Jewell St
- 33 Colonial Way
- 9 Coach Rd
- 46 Mirimichi St
- 84 Messenger St
- 155 South St
- 356 Central St
- 166 Chauncy St
- 150 Gilbert St
- 14 Claire Ave
- 25 Munroe Dr
- 233 Central St
- 150 Rumford Ave Unit 110
- 157 Central St
Your Personal Tour Guide
Ask me questions while you tour the home.