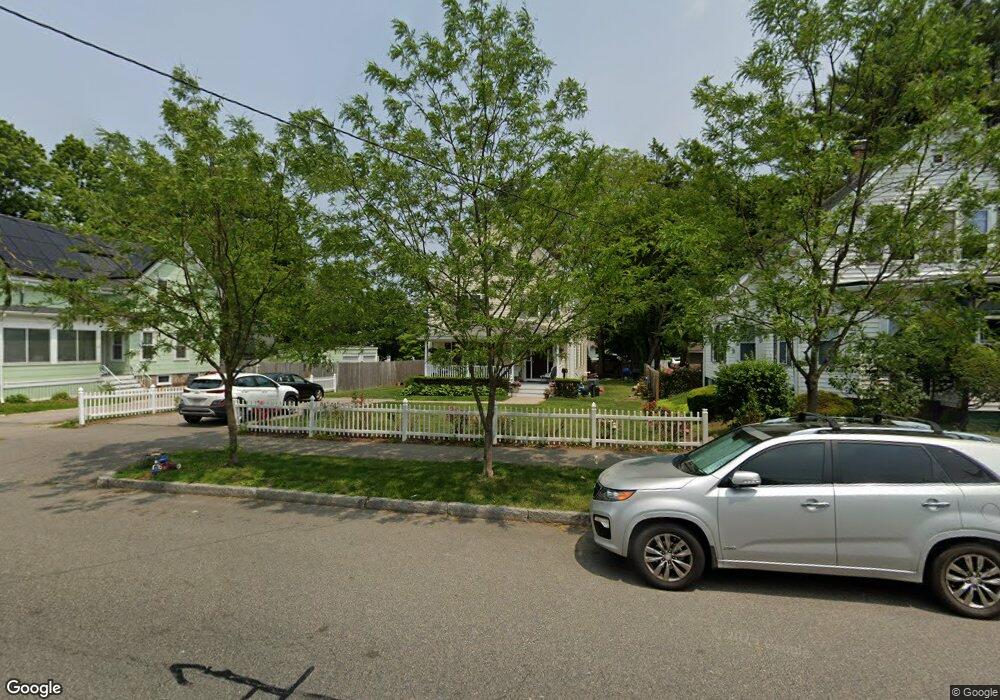
56 Bouve Ave Brockton, MA 02301
Clifton Heights NeighborhoodEstimated Value: $640,406 - $711,000
4
Beds
3
Baths
2,318
Sq Ft
$292/Sq Ft
Est. Value
About This Home
This home is located at 56 Bouve Ave, Brockton, MA 02301 and is currently estimated at $676,852, approximately $291 per square foot. 56 Bouve Ave is a home located in Plymouth County with nearby schools including John F. Kennedy Elementary School, Davis K-8 School, and South Middle School.
Ownership History
Date
Name
Owned For
Owner Type
Purchase Details
Closed on
Jan 31, 2008
Sold by
Roukos Mark
Bought by
Guerra Nyron and Guerra Indra
Current Estimated Value
Home Financials for this Owner
Home Financials are based on the most recent Mortgage that was taken out on this home.
Original Mortgage
$333,000
Outstanding Balance
$211,362
Interest Rate
6.18%
Mortgage Type
Purchase Money Mortgage
Estimated Equity
$465,490
Purchase Details
Closed on
Aug 28, 2007
Sold by
Anasto Renee
Bought by
Roukous Mark
Home Financials for this Owner
Home Financials are based on the most recent Mortgage that was taken out on this home.
Original Mortgage
$170,000
Interest Rate
6.78%
Mortgage Type
Purchase Money Mortgage
Create a Home Valuation Report for This Property
The Home Valuation Report is an in-depth analysis detailing your home's value as well as a comparison with similar homes in the area
Home Values in the Area
Average Home Value in this Area
Purchase History
| Date | Buyer | Sale Price | Title Company |
|---|---|---|---|
| Guerra Nyron | $370,000 | -- | |
| Roukous Mark | $93,000 | -- |
Source: Public Records
Mortgage History
| Date | Status | Borrower | Loan Amount |
|---|---|---|---|
| Open | Roukous Mark | $333,000 | |
| Previous Owner | Roukous Mark | $170,000 |
Source: Public Records
Tax History Compared to Growth
Tax History
| Year | Tax Paid | Tax Assessment Tax Assessment Total Assessment is a certain percentage of the fair market value that is determined by local assessors to be the total taxable value of land and additions on the property. | Land | Improvement |
|---|---|---|---|---|
| 2025 | $6,674 | $551,100 | $140,700 | $410,400 |
| 2024 | $6,411 | $533,400 | $140,700 | $392,700 |
| 2023 | $6,695 | $515,800 | $107,400 | $408,400 |
| 2022 | $6,672 | $477,600 | $97,600 | $380,000 |
| 2021 | $4,776 | $424,500 | $81,800 | $342,700 |
| 2020 | $6,083 | $401,500 | $75,900 | $325,600 |
| 2019 | $4,490 | $367,600 | $73,900 | $293,700 |
| 2018 | $5,607 | $349,100 | $73,900 | $275,200 |
| 2017 | $5,419 | $336,600 | $73,900 | $262,700 |
| 2016 | $5,616 | $323,500 | $71,800 | $251,700 |
| 2015 | $5,414 | $298,300 | $71,800 | $226,500 |
| 2014 | $5,316 | $293,200 | $71,800 | $221,400 |
Source: Public Records
Map
Nearby Homes
- 50 Bouve Ave
- 60 Bouve Ave
- 187 Myrtle St
- 44 Bouve Ave
- 64 Bouve Ave
- 181 Myrtle St
- 249 Grafton St Unit 3
- 249 Grafton St Unit 2
- 249 Grafton St Unit 1
- 249 Grafton St
- 40 Bouve Ave
- 255 Grafton St
- 259 Grafton St
- 53 Bouve Ave
- 186 Myrtle St
- 49 Bouve Ave
- 59 Bouve Ave
- 200 Myrtle St
- 175 Myrtle St
- 175 Myrtle St Unit 2