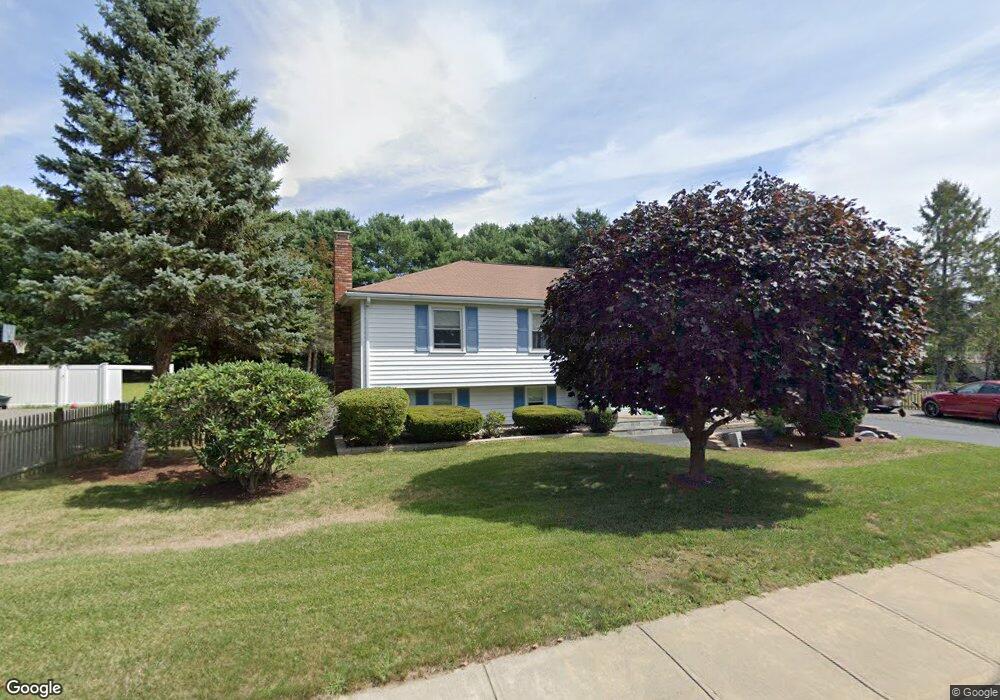
56 Branch St Mansfield, MA 02048
Estimated Value: $598,000 - $719,000
3
Beds
2
Baths
1,144
Sq Ft
$573/Sq Ft
Est. Value
About This Home
This home is located at 56 Branch St, Mansfield, MA 02048 and is currently estimated at $655,618, approximately $573 per square foot. 56 Branch St is a home located in Bristol County with nearby schools including Everett W. Robinson Elementary School, Jordan/Jackson Elementary School, and Harold L. Qualters Middle School.
Ownership History
Date
Name
Owned For
Owner Type
Purchase Details
Closed on
Nov 20, 2024
Sold by
Mccarron Diane and Mccarron Peter
Bought by
Mccarron Ft and Mccarron
Current Estimated Value
Purchase Details
Closed on
Nov 30, 1998
Sold by
Thompson Samuel F and Thompson Ellen L
Bought by
Mccarron Peter and Mccarron Diane
Create a Home Valuation Report for This Property
The Home Valuation Report is an in-depth analysis detailing your home's value as well as a comparison with similar homes in the area
Home Values in the Area
Average Home Value in this Area
Purchase History
| Date | Buyer | Sale Price | Title Company |
|---|---|---|---|
| Mccarron Ft | -- | None Available | |
| Mccarron Ft | -- | None Available | |
| Mccarron Peter | $185,000 | -- | |
| Mccarron Peter | $185,000 | -- |
Source: Public Records
Mortgage History
| Date | Status | Borrower | Loan Amount |
|---|---|---|---|
| Previous Owner | Mccarron Peter | $183,000 | |
| Previous Owner | Mccarron Peter | $50,000 |
Source: Public Records
Tax History
| Year | Tax Paid | Tax Assessment Tax Assessment Total Assessment is a certain percentage of the fair market value that is determined by local assessors to be the total taxable value of land and additions on the property. | Land | Improvement |
|---|---|---|---|---|
| 2025 | $7,043 | $534,800 | $229,200 | $305,600 |
| 2024 | $6,703 | $496,500 | $229,200 | $267,300 |
| 2023 | $6,517 | $462,500 | $229,200 | $233,300 |
| 2022 | $6,300 | $415,300 | $212,200 | $203,100 |
| 2021 | $3,460 | $386,400 | $185,600 | $200,800 |
| 2020 | $5,880 | $382,800 | $176,800 | $206,000 |
| 2019 | $5,379 | $353,400 | $147,400 | $206,000 |
| 2018 | $2,939 | $330,900 | $140,500 | $190,400 |
| 2017 | $2,738 | $330,200 | $136,400 | $193,800 |
| 2016 | $4,910 | $318,600 | $130,000 | $188,600 |
| 2015 | $4,534 | $292,500 | $130,000 | $162,500 |
Source: Public Records
Map
Nearby Homes
- 97 East St
- 2 N Main St Unit B201
- 28 Court St
- 46 Hope St
- 122 Samoset Ave
- 107 Church St
- 22 Pleasant St Unit B
- 25 Kingman Ave
- 166 Chauncy St
- 7 Fieldstone Dr
- 1 Deer Path Ln
- 28 Angell St
- 7 Liberty St
- 619 N Main St
- 631 East St Unit L101
- 14 Windchime Dr
- 16 County St
- 356 Central St
- 4 Erick Rd Unit 90
- 3 Angela Dr
Your Personal Tour Guide
Ask me questions while you tour the home.