Estimated Value: $331,000 - $373,000
4
Beds
3
Baths
2,263
Sq Ft
$157/Sq Ft
Est. Value
About This Home
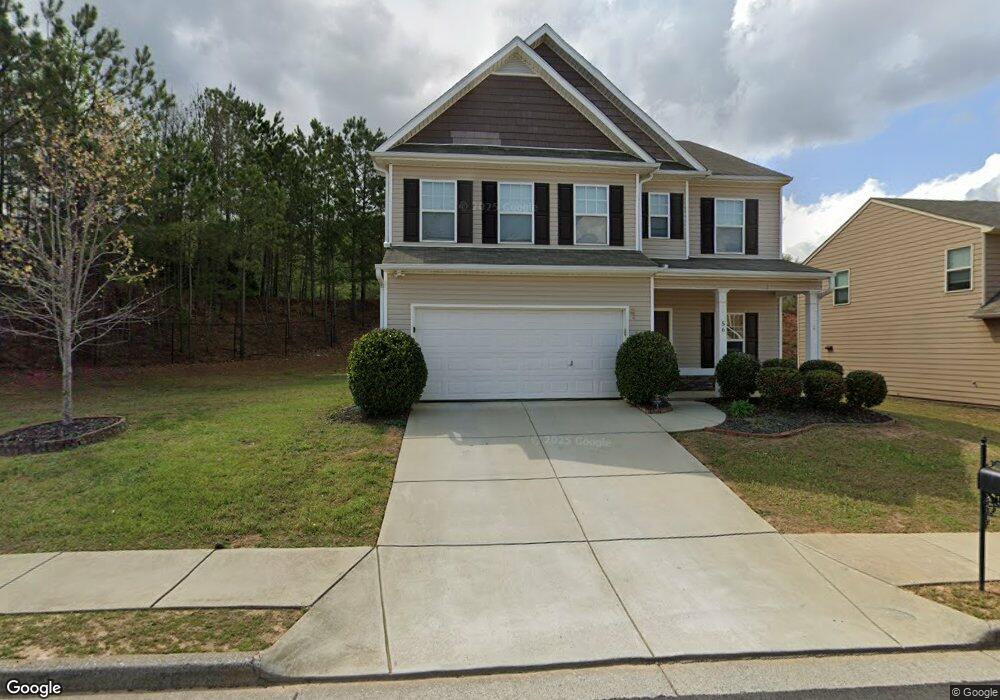
This home is located at 56 Calm Waters Ave Unit 154, Hiram, GA 30141 and is currently estimated at $356,343, approximately $157 per square foot. 56 Calm Waters Ave Unit 154 is a home located in Paulding County with nearby schools including Hiram Elementary School, P. B. Ritch Middle School, and Hiram High School.
Ownership History
Date
Name
Owned For
Owner Type
Purchase Details
Closed on
Jun 28, 2023
Sold by
Open House Atlanta Realty & Investments
Bought by
Nankyu Co Ltd
Current Estimated Value
Purchase Details
Closed on
Dec 27, 2022
Sold by
Hoffman Scott
Bought by
Open House Atlanta Realty & Investments
Purchase Details
Closed on
May 26, 2017
Sold by
Hoffman Scott
Bought by
Hoffman Scott and Hoffman Stephanie Nicole
Home Financials for this Owner
Home Financials are based on the most recent Mortgage that was taken out on this home.
Original Mortgage
$186,459
Interest Rate
4.25%
Mortgage Type
FHA
Purchase Details
Closed on
Jun 16, 2016
Sold by
Piedmont Land Ventures Llc
Bought by
Piedmont Residential Llc
Purchase Details
Closed on
Jun 5, 2015
Sold by
Geosam Capital Us Atlanta Lp
Bought by
Piedmont Land Ventures Llc
Purchase Details
Closed on
Jan 11, 2013
Sold by
Mf Georgia Ii Llc
Bought by
Geosam Capital Us Lp and C/O Td Canada Trust Tower
Create a Home Valuation Report for This Property
The Home Valuation Report is an in-depth analysis detailing your home's value as well as a comparison with similar homes in the area
Home Values in the Area
Average Home Value in this Area
Purchase History
| Date | Buyer | Sale Price | Title Company |
|---|---|---|---|
| Nankyu Co Ltd | $379,000 | -- | |
| Open House Atlanta Realty & Investments | $313,000 | -- | |
| Hoffman Scott | -- | -- | |
| Hoffman Scott | $189,900 | -- | |
| Piedmont Residential Llc | $50,000 | -- | |
| Piedmont Land Ventures Llc | $475,000 | -- | |
| Geosam Capital Us Lp | $47,500 | -- |
Source: Public Records
Mortgage History
| Date | Status | Borrower | Loan Amount |
|---|---|---|---|
| Previous Owner | Hoffman Scott | $186,459 |
Source: Public Records
Tax History Compared to Growth
Tax History
| Year | Tax Paid | Tax Assessment Tax Assessment Total Assessment is a certain percentage of the fair market value that is determined by local assessors to be the total taxable value of land and additions on the property. | Land | Improvement |
|---|---|---|---|---|
| 2024 | $3,615 | $145,312 | $12,000 | $133,312 |
| 2023 | $3,264 | $143,280 | $12,000 | $131,280 |
| 2022 | $2,985 | $114,516 | $12,000 | $102,516 |
| 2021 | $2,818 | $96,972 | $12,000 | $84,972 |
| 2020 | $2,638 | $88,812 | $12,000 | $76,812 |
| 2019 | $2,491 | $82,692 | $12,000 | $70,692 |
| 2018 | $2,289 | $78,692 | $12,000 | $66,692 |
| 2017 | $2,321 | $75,976 | $10,000 | $65,976 |
| 2016 | $302 | $10,000 | $10,000 | $0 |
| 2015 | $86 | $2,800 | $2,800 | $0 |
| 2014 | $40 | $1,280 | $1,280 | $0 |
| 2013 | -- | $1,280 | $1,280 | $0 |
Source: Public Records
Map
Nearby Homes
- 143 Birch St
- 98 Baywood Way
- 273 Baywood Crossing
- 149 Willow Bend Rd
- 2393 Bill Carruth Pkwy
- 133 Willow Bend Rd
- 149 Willow Bend Dr
- 133 Willow Bend Dr
- 322 Lanier Ct
- 79 Kennedy Ct
- 7799 Nebo Rd
- 7606 Nebo Rd
- 261 Township Dr
- 8060 Nebo Rd
- 8060 Nevo Rd
- 153 Oak St
- 74 Bonds Ct
- 585 Hiram Douglasville Hwy
- 64 Cove Dr
- 3124 Hiram Sudie Rd
- 56 Calm Waters Ave
- 42 Calm Waters Ave Unit 155
- 42 Calm Waters Ave
- 30 Calm Waters Ave
- 30 Calm Waters Ave Unit 43
- 57 Calm Waters Ave
- 41 Calm Waters Ave
- 66 Harmony Creek Dr
- 66 Harmony Creek Dr Unit 158
- 69 Calm Waters Ave
- 18 Calm Waters Ave
- 52 Harmony Creek Dr
- 27 Calm Waters Ave
- 72 Harmony Creek Dr
- 42 Harmony Creek Dr
- 15 Calm Waters Ave
- 99 Calm Waters Ave Unit 43
- 99 Calm Waters Ave
- 30 Harmony Creek Dr Unit 161
- 30 Harmony Creek Dr