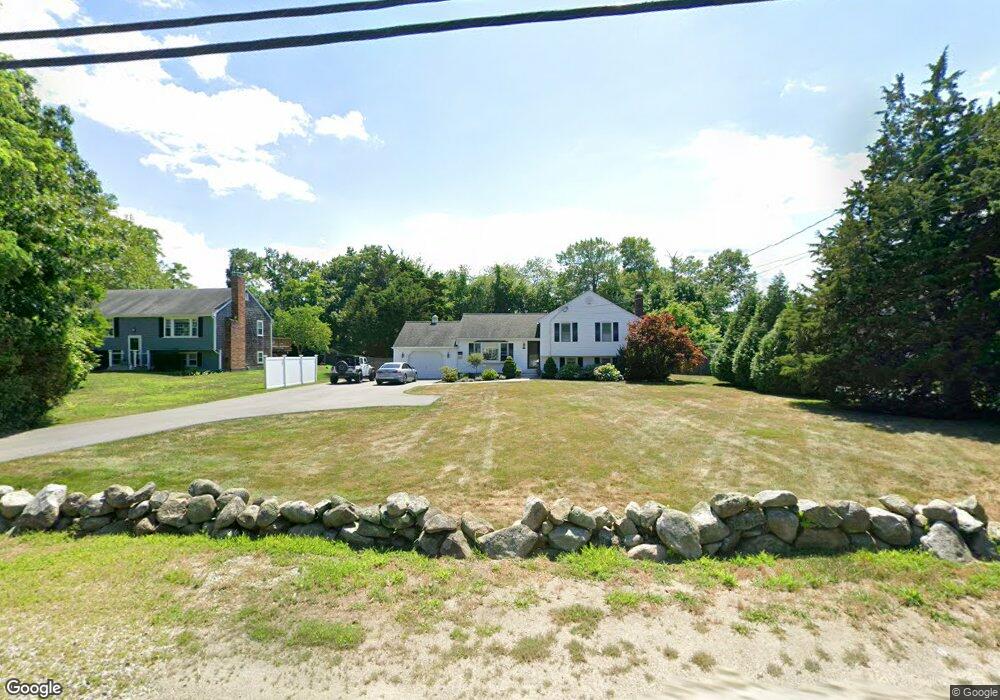
56 Canal St Marshfield, MA 02050
Green Harbor-Cedar Crest NeighborhoodEstimated Value: $736,635 - $834,000
3
Beds
1
Bath
1,600
Sq Ft
$481/Sq Ft
Est. Value
About This Home
This home is located at 56 Canal St, Marshfield, MA 02050 and is currently estimated at $768,909, approximately $480 per square foot. 56 Canal St is a home located in Plymouth County with nearby schools including Governor Edward Winslow School, Furnace Brook Middle School, and Marshfield High School.
Ownership History
Date
Name
Owned For
Owner Type
Purchase Details
Closed on
May 20, 2005
Sold by
Andersen Andrew S and Aandersen Karen T
Bought by
Guarino Frank and Guarino Carolyn A
Current Estimated Value
Purchase Details
Closed on
Jul 7, 1988
Sold by
Mcconville Philip G
Bought by
Faherfty Michael J
Create a Home Valuation Report for This Property
The Home Valuation Report is an in-depth analysis detailing your home's value as well as a comparison with similar homes in the area
Home Values in the Area
Average Home Value in this Area
Purchase History
| Date | Buyer | Sale Price | Title Company |
|---|---|---|---|
| Guarino Frank | $472,500 | -- | |
| Guarino Frank | $472,500 | -- | |
| Faherfty Michael J | $165,000 | -- |
Source: Public Records
Mortgage History
| Date | Status | Borrower | Loan Amount |
|---|---|---|---|
| Previous Owner | Faherfty Michael J | $228,000 | |
| Previous Owner | Faherfty Michael J | $27,000 | |
| Previous Owner | Faherfty Michael J | $189,600 |
Source: Public Records
Tax History Compared to Growth
Tax History
| Year | Tax Paid | Tax Assessment Tax Assessment Total Assessment is a certain percentage of the fair market value that is determined by local assessors to be the total taxable value of land and additions on the property. | Land | Improvement |
|---|---|---|---|---|
| 2025 | $6,095 | $615,700 | $270,800 | $344,900 |
| 2024 | $5,890 | $566,900 | $260,400 | $306,500 |
| 2023 | $5,544 | $515,900 | $239,600 | $276,300 |
| 2022 | $5,544 | $428,100 | $208,300 | $219,800 |
| 2021 | $5,454 | $413,500 | $208,300 | $205,200 |
| 2020 | $5,252 | $394,000 | $197,900 | $196,100 |
| 2019 | $5,272 | $394,000 | $197,900 | $196,100 |
| 2018 | $5,268 | $394,000 | $197,900 | $196,100 |
| 2017 | $4,657 | $339,400 | $187,500 | $151,900 |
| 2016 | $4,573 | $329,500 | $187,500 | $142,000 |
| 2015 | $4,379 | $329,500 | $187,500 | $142,000 |
| 2014 | $4,184 | $314,800 | $187,500 | $127,300 |
Source: Public Records
Map
Nearby Homes
- 106 Careswell St
- 5 Adelaide Way
- 71 Gurnet Rd
- 90 Presidential Cir
- 57 Island St
- 78 Tower Ave
- 256 Ocean St
- 335 Ocean St
- 328 Ocean St
- 32 Gratto Rd
- 74 Abrams Hill Rd
- 68 Abrams Hill Rd
- 24 Second (2nd) Rd
- 19 2nd Rd
- 39 Bay Pond Rd
- 387 Lot 2A Old Cove Rd
- 387 Lot 3A Old Cove Rd
- 387 Lot 4A Old Cove Rd
- 236 Powder Point Ave
- 713 Webster St