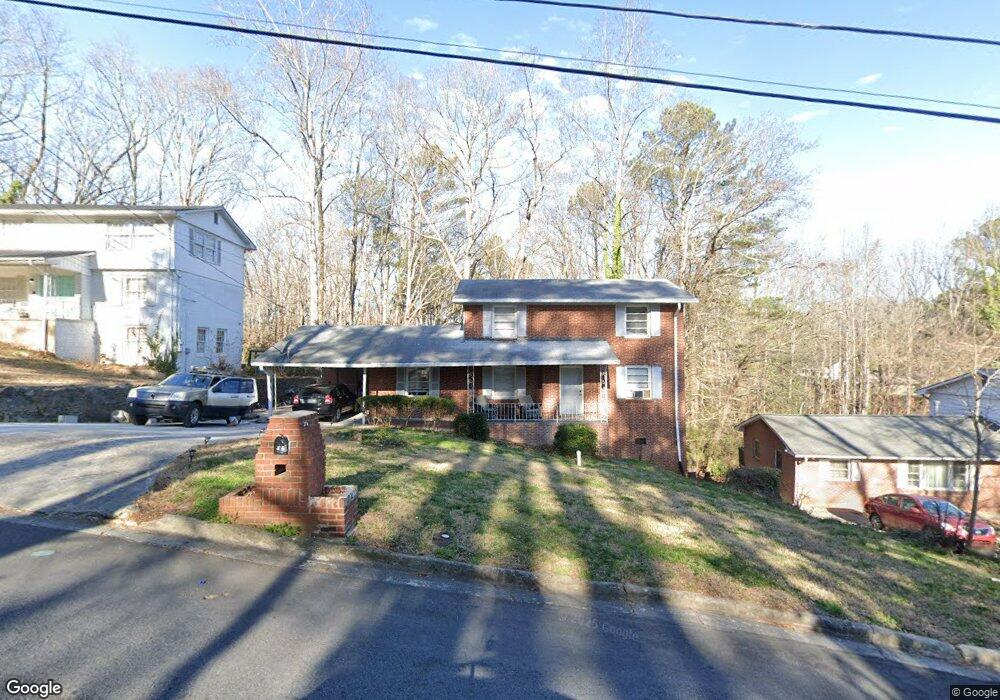
56 Candlelight Ln SW Atlanta, GA 30331
Baker Hills NeighborhoodEstimated Value: $274,000 - $319,000
5
Beds
3
Baths
2,600
Sq Ft
$116/Sq Ft
Est. Value
About This Home
This home is located at 56 Candlelight Ln SW, Atlanta, GA 30331 and is currently estimated at $300,744, approximately $115 per square foot. 56 Candlelight Ln SW is a home located in Fulton County with nearby schools including L.P. Miles Elementary School, Young Middle School, and Mays High School.
Ownership History
Date
Name
Owned For
Owner Type
Purchase Details
Closed on
Dec 29, 2011
Sold by
Holt Ronnie
Bought by
Rttt Corp
Current Estimated Value
Purchase Details
Closed on
Mar 18, 2009
Sold by
Fremont Trust 2005 & E
Bought by
Standby Holt Ronnie and Standby D
Purchase Details
Closed on
Feb 6, 2007
Sold by
Rutherford Richard
Bought by
Fremont Investment & Loan
Purchase Details
Closed on
Sep 28, 2005
Sold by
Binns Willie L
Bought by
Rutherford Richard
Home Financials for this Owner
Home Financials are based on the most recent Mortgage that was taken out on this home.
Original Mortgage
$29,980
Interest Rate
5.66%
Mortgage Type
Stand Alone Refi Refinance Of Original Loan
Purchase Details
Closed on
Aug 29, 1997
Sold by
Silvers Joseph H and Silver Rosalyn
Bought by
Binns Willie L
Home Financials for this Owner
Home Financials are based on the most recent Mortgage that was taken out on this home.
Original Mortgage
$85,241
Interest Rate
7.46%
Mortgage Type
FHA
Create a Home Valuation Report for This Property
The Home Valuation Report is an in-depth analysis detailing your home's value as well as a comparison with similar homes in the area
Home Values in the Area
Average Home Value in this Area
Purchase History
| Date | Buyer | Sale Price | Title Company |
|---|---|---|---|
| Rttt Corp | -- | -- | |
| Standby Holt Ronnie | $19,000 | -- | |
| Fremont Investment & Loan | $82,800 | -- | |
| Rutherford Richard | $149,900 | -- | |
| Binns Willie L | $86,000 | -- |
Source: Public Records
Mortgage History
| Date | Status | Borrower | Loan Amount |
|---|---|---|---|
| Previous Owner | Rutherford Richard | $29,980 | |
| Previous Owner | Binns Willie L | $85,241 |
Source: Public Records
Tax History Compared to Growth
Tax History
| Year | Tax Paid | Tax Assessment Tax Assessment Total Assessment is a certain percentage of the fair market value that is determined by local assessors to be the total taxable value of land and additions on the property. | Land | Improvement |
|---|---|---|---|---|
| 2025 | $3,145 | $108,000 | $7,440 | $100,560 |
| 2023 | $5,286 | $127,680 | $7,440 | $120,240 |
| 2022 | $3,812 | $94,200 | $22,120 | $72,080 |
| 2021 | $2,121 | $68,480 | $14,480 | $54,000 |
| 2020 | $2,358 | $57,560 | $10,960 | $46,600 |
| 2019 | $491 | $24,680 | $6,400 | $18,280 |
| 2018 | $1,022 | $24,680 | $6,400 | $18,280 |
| 2017 | $906 | $24,680 | $6,400 | $18,280 |
| 2016 | $1,069 | $24,680 | $6,400 | $18,280 |
| 2015 | $1,563 | $24,680 | $6,400 | $18,280 |
| 2014 | $1,119 | $24,680 | $6,400 | $18,280 |
Source: Public Records
Map
Nearby Homes
- 7098 Chara Ln SW
- 4142 Woodland Park Dr SW
- 4015 Bakers Ferry Rd SW
- 4020 Ester Dr SW
- 4063 Cornell Blvd SW
- 4039 Codel St SW
- 273 Fennel Way SW
- 3961 Cornell Blvd SW
- 3877 Bakers Ferry
- 3981 Rutgers Dr SW
- 3911 Cornell Blvd SW
- 259 Tarragon Way SW
- 3991 Adamsville Dr SW
- 294 Leland Place SW
- 3798 Bakers Ferry Rd SW
- 446 Tarragon Way SW
- 482 Tarragon Way SW
- 4310 Bakers Ferry Rd SW
- 154 Dollar Mill Rd SW
- 64 Candlelight Ln SW
- 48 Candlelight Ln SW
- 40 Candlelight Ln SW Unit A
- 40 Candlelight Ln SW
- 59 Candlelight Ln SW
- 4175 Renfrew Ct SW Unit A
- 4175 Renfrew Ct SW
- 70 Candlelight Ln SW
- 65 Candlelight Ln SW
- 4165 Renfrew Ct SW
- 34 Candlelight Ln SW
- 74 Candlelight Ln SW
- 75 Candlelight Ln SW
- 4155 Renfrew Ct SW
- 4180 Renfrew Ct SW Unit 3
- 0 Renfrew Ct SW Unit 8149254
- 0 Renfrew Ct SW Unit 7417996
- 0 Renfrew Ct SW Unit 8415801
- 0 Renfrew Ct SW Unit 7322376
- 28 Candlelight Ln SW