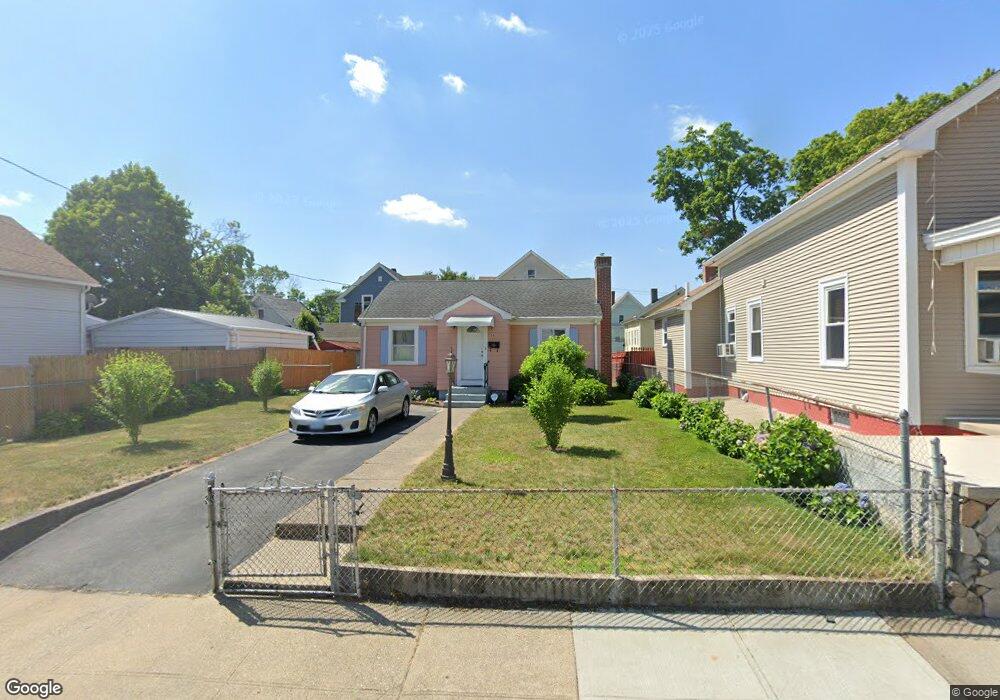
56 Carpenter St Pawtucket, RI 02860
Downtown Pawtucket NeighborhoodEstimated Value: $201,000 - $339,000
1
Bed
1
Bath
1,520
Sq Ft
$182/Sq Ft
Est. Value
About This Home
This home is located at 56 Carpenter St, Pawtucket, RI 02860 and is currently estimated at $276,330, approximately $181 per square foot. 56 Carpenter St is a home located in Providence County with nearby schools including International Charter School, Blackstone Valley Prep Junior High School, and Blackstone Academy Charter School.
Ownership History
Date
Name
Owned For
Owner Type
Purchase Details
Closed on
Mar 2, 2001
Sold by
James William J Est
Bought by
Damaso Jose R
Current Estimated Value
Home Financials for this Owner
Home Financials are based on the most recent Mortgage that was taken out on this home.
Original Mortgage
$25,000
Outstanding Balance
$8,862
Interest Rate
7%
Estimated Equity
$267,468
Create a Home Valuation Report for This Property
The Home Valuation Report is an in-depth analysis detailing your home's value as well as a comparison with similar homes in the area
Home Values in the Area
Average Home Value in this Area
Purchase History
| Date | Buyer | Sale Price | Title Company |
|---|---|---|---|
| Damaso Jose R | $53,000 | -- |
Source: Public Records
Mortgage History
| Date | Status | Borrower | Loan Amount |
|---|---|---|---|
| Open | Damaso Jose R | $25,000 |
Source: Public Records
Tax History
| Year | Tax Paid | Tax Assessment Tax Assessment Total Assessment is a certain percentage of the fair market value that is determined by local assessors to be the total taxable value of land and additions on the property. | Land | Improvement |
|---|---|---|---|---|
| 2025 | $2,847 | $216,500 | $118,300 | $98,200 |
| 2024 | $2,672 | $216,500 | $118,300 | $98,200 |
| 2023 | $2,238 | $132,100 | $53,200 | $78,900 |
| 2022 | $2,190 | $132,100 | $53,200 | $78,900 |
| 2021 | $2,190 | $132,100 | $53,200 | $78,900 |
| 2020 | $2,348 | $112,400 | $53,900 | $58,500 |
| 2019 | $2,348 | $112,400 | $53,900 | $58,500 |
| 2018 | $2,263 | $112,400 | $53,900 | $58,500 |
| 2017 | $2,006 | $88,300 | $41,000 | $47,300 |
| 2016 | $1,933 | $88,300 | $41,000 | $47,300 |
| 2015 | $1,933 | $88,300 | $41,000 | $47,300 |
| 2014 | $2,168 | $94,000 | $52,700 | $41,300 |
Source: Public Records
Map
Nearby Homes
- 264 Weeden St
- 17 Beecher St
- 27 Lloyd St
- 390 Weeden St
- 14 Martin Ct
- 48 Star St
- 193 Harrison St
- 76 Slater St
- 75 Baldwin St
- 75 Larch St
- 546 Lonsdale Ave Unit 548
- 58 Lawn Ave
- 59 West Ave
- 616 Lonsdale Ave Unit 618
- 57 Garden St
- 107 Mulberry St
- 45 Harrison St
- 28 Bayley St Unit 107
- 584 Weeden St
- 163 West Ave
- 62 Carpenter St
- 50 Carpenter St
- 68 Carpenter St
- 68 Carpenter St Unit Carpenter
- 285 Weeden St
- 291 Weeden St
- 283 Weeden St
- 277 Weeden St
- 297 Weeden St
- 271 Weeden St
- 49 Carpenter St
- 72 Carpenter St
- 55 Carpenter St
- 61 Carpenter St
- 38 Carpenter St
- 67 Carpenter St
- 32 Coleman St
- 303 Weeden St
- 28 Coleman St
- 267 Weeden St