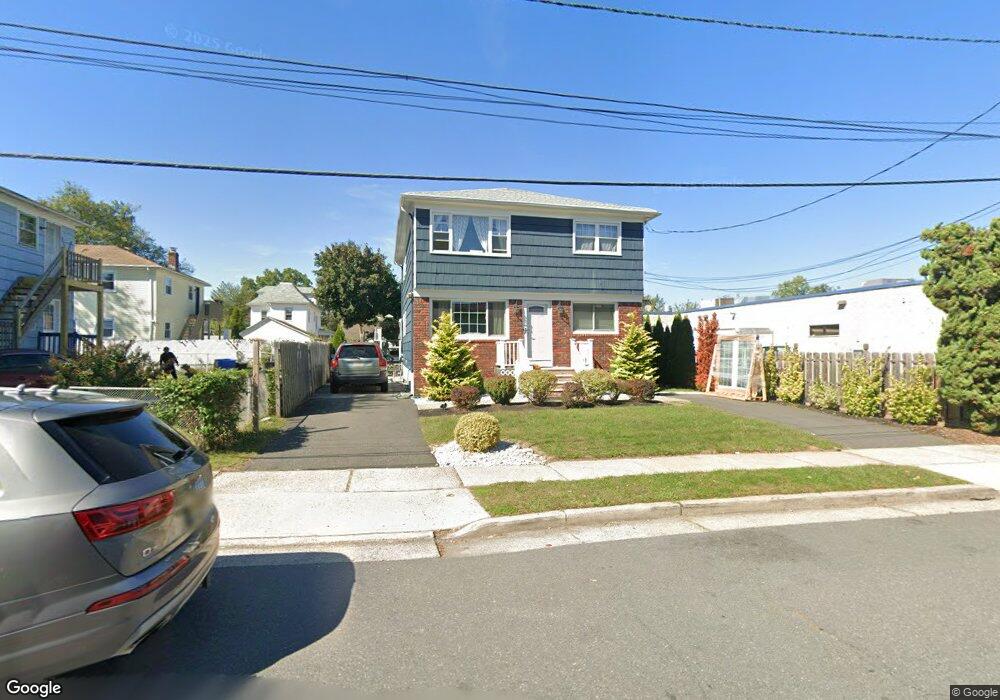
56 Cherry St South Bound Brook, NJ 08880
Estimated Value: $497,000 - $541,000
--
Bed
--
Bath
1,950
Sq Ft
$261/Sq Ft
Est. Value
About This Home
This home is located at 56 Cherry St, South Bound Brook, NJ 08880 and is currently estimated at $509,833, approximately $261 per square foot. 56 Cherry St is a home located in Somerset County with nearby schools including Robert Morris School and Green Brook Academy.
Ownership History
Date
Name
Owned For
Owner Type
Purchase Details
Closed on
May 15, 2024
Sold by
Castillo Ana L and Molina Griselda E
Bought by
Molina Griselda E
Current Estimated Value
Home Financials for this Owner
Home Financials are based on the most recent Mortgage that was taken out on this home.
Original Mortgage
$272,000
Outstanding Balance
$268,186
Interest Rate
6.88%
Mortgage Type
New Conventional
Estimated Equity
$241,647
Purchase Details
Closed on
Mar 14, 2011
Sold by
Krom Robert and Krom Elysa C
Bought by
Molina Geiselda E and Castillo Ana L
Home Financials for this Owner
Home Financials are based on the most recent Mortgage that was taken out on this home.
Original Mortgage
$238,789
Interest Rate
5.5%
Mortgage Type
FHA
Purchase Details
Closed on
Jan 15, 1998
Sold by
Krambeck Robert
Bought by
Krom Robert and Krom Elysa
Create a Home Valuation Report for This Property
The Home Valuation Report is an in-depth analysis detailing your home's value as well as a comparison with similar homes in the area
Home Values in the Area
Average Home Value in this Area
Purchase History
| Date | Buyer | Sale Price | Title Company |
|---|---|---|---|
| Molina Griselda E | -- | None Listed On Document | |
| Molina Griselda E | -- | None Listed On Document | |
| Molina Geiselda E | $245,000 | First American Title Ins Co | |
| Krom Robert | $155,000 | -- |
Source: Public Records
Mortgage History
| Date | Status | Borrower | Loan Amount |
|---|---|---|---|
| Open | Molina Griselda E | $272,000 | |
| Closed | Molina Griselda E | $272,000 | |
| Previous Owner | Molina Geiselda E | $238,789 |
Source: Public Records
Tax History Compared to Growth
Tax History
| Year | Tax Paid | Tax Assessment Tax Assessment Total Assessment is a certain percentage of the fair market value that is determined by local assessors to be the total taxable value of land and additions on the property. | Land | Improvement |
|---|---|---|---|---|
| 2025 | $10,335 | $270,400 | $94,100 | $176,300 |
| 2024 | $10,335 | $270,400 | $94,100 | $176,300 |
| 2023 | $10,237 | $270,400 | $94,100 | $176,300 |
| 2022 | $9,567 | $270,400 | $94,100 | $176,300 |
| 2021 | $9,429 | $270,400 | $94,100 | $176,300 |
| 2020 | $8,969 | $270,400 | $94,100 | $176,300 |
| 2019 | $9,202 | $270,400 | $94,100 | $176,300 |
| 2018 | $9,150 | $270,400 | $94,100 | $176,300 |
| 2017 | $9,118 | $270,400 | $94,100 | $176,300 |
| 2016 | $8,912 | $270,400 | $94,100 | $176,300 |
| 2015 | $8,677 | $270,400 | $94,100 | $176,300 |
| 2014 | $8,469 | $270,400 | $94,100 | $176,300 |
Source: Public Records
Map
Nearby Homes
- 20 Patriots Path
- 123 Elizabeth St
- 165 Prospect St
- 3 Edgewood Terrace
- 71 Remsen St
- 8 Von Steuben Ln
- 231 Beck Ave
- 206 Bathgate Ave
- 112 East St
- 285 Maple Ave
- 535 Madison Ave
- 2 Drake St
- 208 Sanders Ave
- 112-114 E Union Ave
- 34 van Keuren Ave Unit 38
- 112 E Union Ave
- 320 Church St
- 40 van Keuren Ave Unit 42
- 10 Maplehurst Ln
- 126 W High St