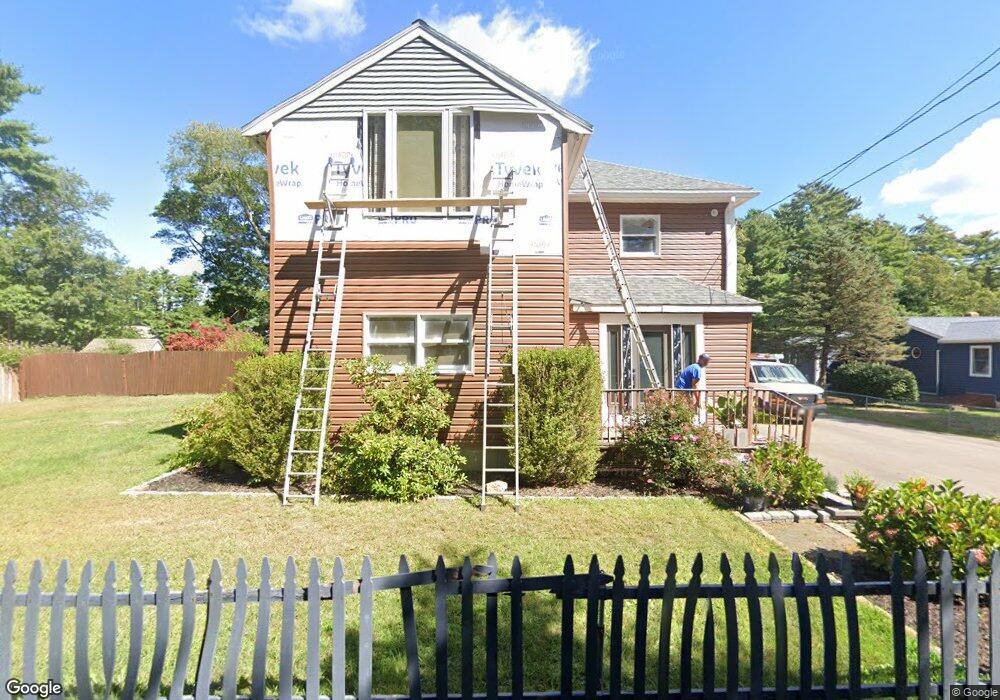
56 Chipaway Rd East Freetown, MA 02717
Estimated Value: $568,000 - $760,000
4
Beds
3
Baths
2,244
Sq Ft
$285/Sq Ft
Est. Value
About This Home
This home is located at 56 Chipaway Rd, East Freetown, MA 02717 and is currently estimated at $638,640, approximately $284 per square foot. 56 Chipaway Rd is a home located in Bristol County with nearby schools including Freetown Elementary School, George R Austin Intermediate School, and Freetown-Lakeville Middle School.
Ownership History
Date
Name
Owned For
Owner Type
Purchase Details
Closed on
Jul 1, 2022
Sold by
Baker Gene E and Baker Kristine M
Bought by
Baker Gene E and Baker Kristine M
Current Estimated Value
Create a Home Valuation Report for This Property
The Home Valuation Report is an in-depth analysis detailing your home's value as well as a comparison with similar homes in the area
Home Values in the Area
Average Home Value in this Area
Purchase History
| Date | Buyer | Sale Price | Title Company |
|---|---|---|---|
| Baker Gene E | -- | None Available |
Source: Public Records
Tax History Compared to Growth
Tax History
| Year | Tax Paid | Tax Assessment Tax Assessment Total Assessment is a certain percentage of the fair market value that is determined by local assessors to be the total taxable value of land and additions on the property. | Land | Improvement |
|---|---|---|---|---|
| 2025 | $5,213 | $526,000 | $155,100 | $370,900 |
| 2024 | $5,134 | $492,200 | $146,300 | $345,900 |
| 2023 | $5,009 | $467,700 | $131,800 | $335,900 |
| 2022 | $4,775 | $395,900 | $111,600 | $284,300 |
| 2021 | $4,620 | $363,800 | $101,500 | $262,300 |
| 2020 | $4,629 | $355,500 | $97,600 | $257,900 |
| 2019 | $4,403 | $334,800 | $93,000 | $241,800 |
| 2018 | $4,155 | $312,200 | $93,000 | $219,200 |
| 2017 | $4,057 | $304,600 | $93,000 | $211,600 |
| 2016 | $3,905 | $298,300 | $90,300 | $208,000 |
| 2015 | $3,827 | $296,700 | $90,300 | $206,400 |
| 2014 | $3,682 | $292,000 | $88,400 | $203,600 |
Source: Public Records
Map
Nearby Homes
- 595 Quanapoag Rd
- 599 Quanapoag Rd
- 1599 Braley Rd Unit 68
- 1573 Braley Rd Unit 39
- 0 Costa Dr
- 122 Quanapoag Rd
- 13 Luscomb Ln
- 16 Swallow St
- 150 Quanapoag Rd
- 1069 Cherokee St
- 4597 Acushnet Ave
- 3 Elaine Ave
- Lot 2/3 Quanapoag Rd
- 64 Blaze Rd
- 210 Heritage Dr
- 23 Parker Dr
- 34 Poplar Rd
- 144 Chace Rd
- 145 Heritage Dr
- 26 Blueberry Dr