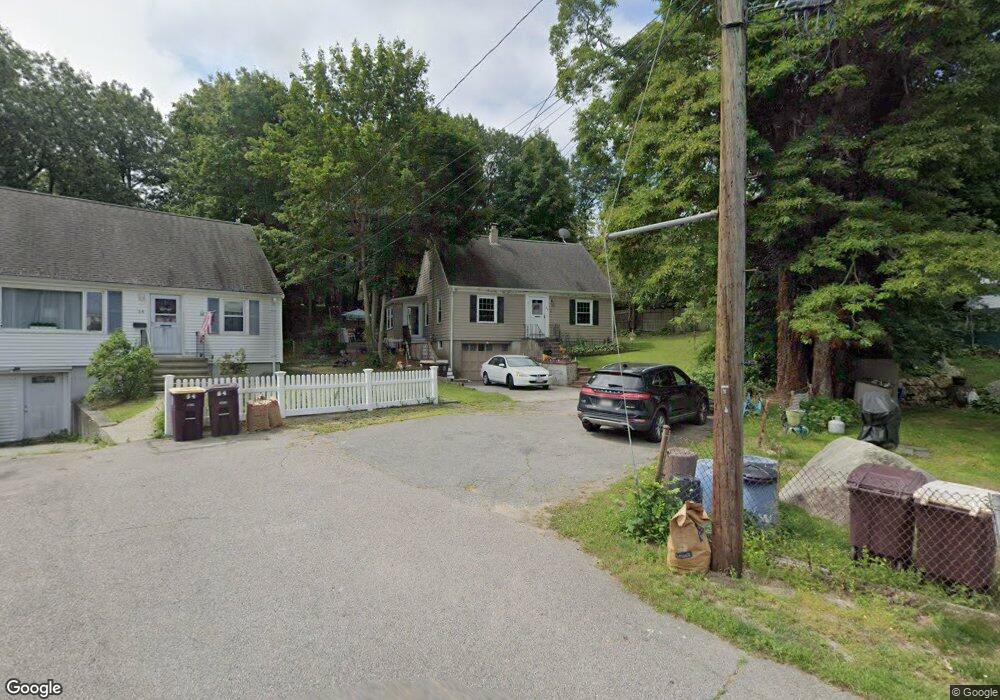
56 Clapp Ave Weymouth, MA 02188
Weymouth Landing NeighborhoodEstimated Value: $578,000 - $605,380
3
Beds
2
Baths
1,596
Sq Ft
$371/Sq Ft
Est. Value
About This Home
This home is located at 56 Clapp Ave, Weymouth, MA 02188 and is currently estimated at $591,595, approximately $370 per square foot. 56 Clapp Ave is a home located in Norfolk County with nearby schools including Abigail Adams Middle School, Frederick C Murphy, and Weymouth Middle School Chapman.
Ownership History
Date
Name
Owned For
Owner Type
Purchase Details
Closed on
Dec 19, 2011
Sold by
Hurney Thomas E
Bought by
Hurney William J
Current Estimated Value
Purchase Details
Closed on
Jul 3, 2009
Sold by
Hurney John D
Bought by
Hurney William J
Purchase Details
Closed on
Sep 2, 2004
Sold by
Hurney Alice L and Hurney William J
Bought by
Hurney John D and Hurney Thomas F
Create a Home Valuation Report for This Property
The Home Valuation Report is an in-depth analysis detailing your home's value as well as a comparison with similar homes in the area
Home Values in the Area
Average Home Value in this Area
Purchase History
| Date | Buyer | Sale Price | Title Company |
|---|---|---|---|
| Hurney William J | -- | -- | |
| Hurney William J | -- | -- | |
| Hurney John D | -- | -- |
Source: Public Records
Tax History Compared to Growth
Tax History
| Year | Tax Paid | Tax Assessment Tax Assessment Total Assessment is a certain percentage of the fair market value that is determined by local assessors to be the total taxable value of land and additions on the property. | Land | Improvement |
|---|---|---|---|---|
| 2025 | $5,309 | $525,600 | $192,400 | $333,200 |
| 2024 | $5,141 | $500,600 | $183,200 | $317,400 |
| 2023 | $4,947 | $473,400 | $169,600 | $303,800 |
| 2022 | $4,806 | $419,400 | $157,100 | $262,300 |
| 2021 | $4,505 | $383,700 | $157,100 | $226,600 |
| 2020 | $4,265 | $357,800 | $157,100 | $200,700 |
| 2019 | $4,160 | $343,200 | $151,000 | $192,200 |
| 2018 | $4,025 | $322,000 | $143,800 | $178,200 |
| 2017 | $3,962 | $309,300 | $137,000 | $172,300 |
| 2016 | $3,808 | $297,500 | $131,800 | $165,700 |
| 2015 | $3,674 | $284,800 | $131,800 | $153,000 |
| 2014 | $3,276 | $246,300 | $110,300 | $136,000 |
Source: Public Records
Map
Nearby Homes
- 19 Vine St Unit 3
- 19 Vine St Unit 1
- 114 Broad St Unit D
- 114 Broad St Unit C
- 23-25 Lindbergh Ave
- 16 Lindbergh Ave
- 286 Broad St
- 11 Richmond St
- 33 Congress St
- 12 Klasson Ln
- 76 Kingman St
- 122 Washington St Unit 22
- 286 Essex St
- 15 Summer St
- 367 Essex St
- 24 Blake Rd
- 54 Federal St
- 294 Commercial St
- 42 Sundin Rd
- 36 Brookside Rd