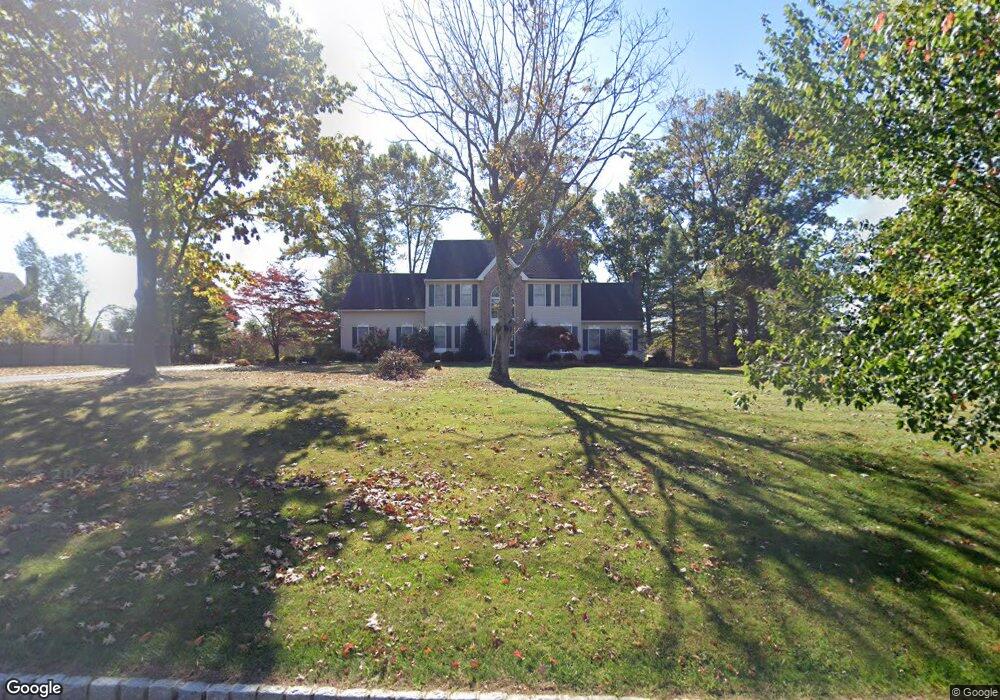
56 Clover Hill Rd Flemington, NJ 08822
Estimated Value: $806,752 - $854,000
Studio
--
Bath
2,933
Sq Ft
$283/Sq Ft
Est. Value
About This Home
This home is located at 56 Clover Hill Rd, Flemington, NJ 08822 and is currently estimated at $831,188, approximately $283 per square foot. 56 Clover Hill Rd is a home located in Hunterdon County with nearby schools including Copper Hill School, J.P. Case Middle School, and Reading Fleming Intermediate School.
Ownership History
Date
Name
Owned For
Owner Type
Purchase Details
Closed on
Jun 4, 1999
Sold by
Nutrend Construction Llc
Bought by
Redling Kurt J and Redling Debra A
Current Estimated Value
Home Financials for this Owner
Home Financials are based on the most recent Mortgage that was taken out on this home.
Original Mortgage
$199,900
Outstanding Balance
$52,069
Interest Rate
6.9%
Estimated Equity
$779,119
Create a Home Valuation Report for This Property
The Home Valuation Report is an in-depth analysis detailing your home's value as well as a comparison with similar homes in the area
Home Values in the Area
Average Home Value in this Area
Purchase History
| Date | Buyer | Sale Price | Title Company |
|---|---|---|---|
| Redling Kurt J | $314,900 | -- | |
| Nutrend Construction Llc | $97,000 | -- |
Source: Public Records
Mortgage History
| Date | Status | Borrower | Loan Amount |
|---|---|---|---|
| Open | Nutrend Construction Llc | $199,900 |
Source: Public Records
Tax History
| Year | Tax Paid | Tax Assessment Tax Assessment Total Assessment is a certain percentage of the fair market value that is determined by local assessors to be the total taxable value of land and additions on the property. | Land | Improvement |
|---|---|---|---|---|
| 2025 | $13,567 | $468,300 | $179,500 | $288,800 |
| 2024 | $12,756 | $468,300 | $179,500 | $288,800 |
Source: Public Records
Map
Nearby Homes
- 229 Hockenbury Rd
- 30 Claridge Ln
- 215 Kuhl Rd
- 18 Burnett Ct
- 3 Meadow Lark Ct
- 10 Samuel Dr
- 18 Wells Rd
- 423 Wertsville Rd
- 6 Elm Terrace
- 6 Dogwood Cir
- 8 Dogwood Cir
- 822 Poplar Ct Unit 822
- 91 Briar Way
- 265 Spruce Ct Unit 265
- 269 Spruce Ct Unit 269
- 38 Larsen Rd
- 4 Peach Ct
- 317 Jamestown Ct
- 107 Samson Dr
- 418 Hawthorne Ct
Your Personal Tour Guide
Ask me questions while you tour the home.