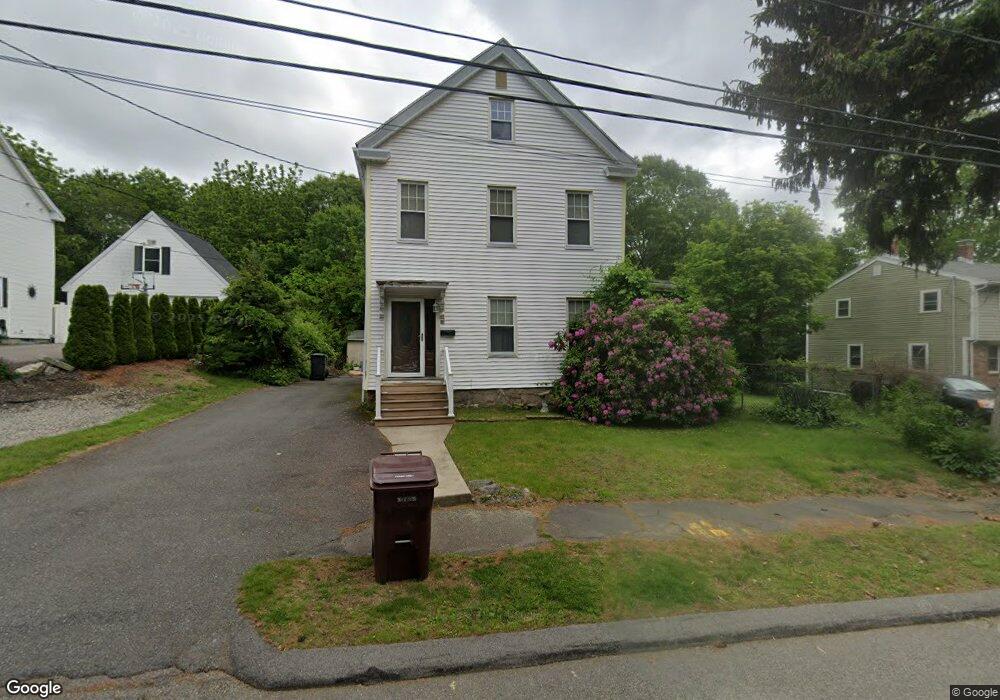
56 Colburn St Dedham, MA 02026
East Dedham NeighborhoodEstimated Value: $744,498 - $920,000
3
Beds
2
Baths
2,229
Sq Ft
$368/Sq Ft
Est. Value
About This Home
This home is located at 56 Colburn St, Dedham, MA 02026 and is currently estimated at $819,375, approximately $367 per square foot. 56 Colburn St is a home located in Norfolk County with nearby schools including Avery, Dedham Middle School, and Dedham High School.
Ownership History
Date
Name
Owned For
Owner Type
Purchase Details
Closed on
Nov 10, 1989
Sold by
Digiacomo Anthony
Bought by
Naddaff Jenny A
Current Estimated Value
Home Financials for this Owner
Home Financials are based on the most recent Mortgage that was taken out on this home.
Original Mortgage
$65,000
Interest Rate
10.03%
Mortgage Type
Purchase Money Mortgage
Create a Home Valuation Report for This Property
The Home Valuation Report is an in-depth analysis detailing your home's value as well as a comparison with similar homes in the area
Home Values in the Area
Average Home Value in this Area
Purchase History
| Date | Buyer | Sale Price | Title Company |
|---|---|---|---|
| Naddaff Jenny A | $154,000 | -- |
Source: Public Records
Mortgage History
| Date | Status | Borrower | Loan Amount |
|---|---|---|---|
| Closed | Naddaff Jenny A | $57,000 | |
| Closed | Naddaff Jenny A | $65,000 |
Source: Public Records
Tax History Compared to Growth
Tax History
| Year | Tax Paid | Tax Assessment Tax Assessment Total Assessment is a certain percentage of the fair market value that is determined by local assessors to be the total taxable value of land and additions on the property. | Land | Improvement |
|---|---|---|---|---|
| 2025 | $7,794 | $617,600 | $270,700 | $346,900 |
| 2024 | $7,426 | $594,100 | $256,300 | $337,800 |
| 2023 | $7,162 | $557,800 | $227,600 | $330,200 |
| 2022 | $6,809 | $510,000 | $222,800 | $287,200 |
| 2021 | $6,321 | $462,400 | $218,000 | $244,400 |
| 2020 | $6,210 | $452,600 | $208,300 | $244,300 |
| 2019 | $5,943 | $420,000 | $181,200 | $238,800 |
| 2018 | $5,920 | $406,900 | $160,800 | $246,100 |
| 2017 | $5,693 | $385,700 | $150,600 | $235,100 |
| 2016 | $5,372 | $346,800 | $131,400 | $215,400 |
| 2015 | $5,359 | $337,700 | $127,800 | $209,900 |
| 2014 | $5,192 | $322,900 | $124,900 | $198,000 |
Source: Public Records
Map
Nearby Homes
- 69 Berlin St
- 38 Joan Rd
- 94 Rockland St
- 70 Birchwood St
- 42 Raldne Rd Unit 1
- 83 Mount Hope St
- 45 Dietz Rd
- 38 Fleming St
- 25R Rockland St Unit 6
- 2 Alwin St
- 11 Cheriton Rd Unit 102B
- 40 Unit 207
- 3 Lewis Farm Rd
- 108 High St
- 7 S Stone Mill Dr Unit 403
- 235 Curve St
- 150 Grove St
- 45 Weymouth Ave
- 87 Sunnyside St Unit 87
- 115 Grove St Unit 11
- 60 Colburn St
- 62 Colburn St Unit 62
- 32 Colburn St
- 64 Colburn St Unit 64
- 28 Colburn St
- 68 Colburn St
- 31 Colburn St
- 26 Bismark St
- 63 Hyde Park St
- 68 Whitehall St
- 27 Colburn St
- 75 Hyde Park St
- 75 Hyde Park St Unit 3
- 73 Colburn St
- 73 Colburn St Unit 2
- 76 Colburn St
- 74 Colburn St
- 53 Hyde Park St
- 25 Colburn St
- 24 Colburn St