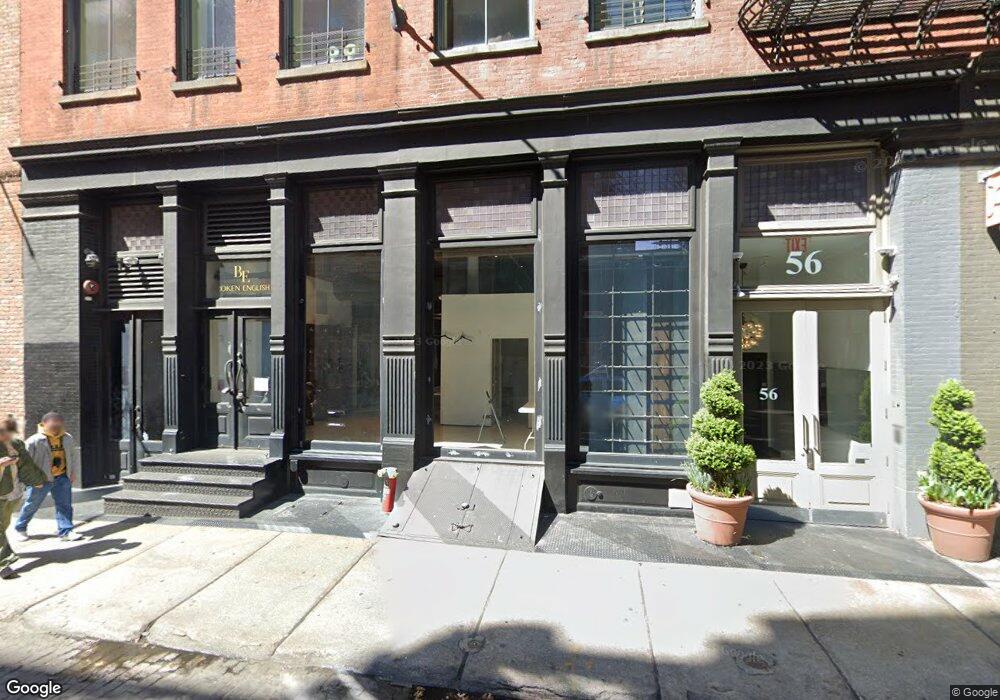
56 Crosby St Unit C1 New York, NY 10012
SoHo NeighborhoodEstimated Value: $5,573,000 - $25,827,764
--
Bed
--
Bath
19,760
Sq Ft
$795/Sq Ft
Est. Value
About This Home
This home is located at 56 Crosby St Unit C1, New York, NY 10012 and is currently estimated at $15,700,382, approximately $794 per square foot. 56 Crosby St Unit C1 is a home located in New York County with nearby schools including P.S. 130 - Hernando De Soto, M.S. 131 Dr. Sun Yat Sen, and Clinton School.
Ownership History
Date
Name
Owned For
Owner Type
Purchase Details
Closed on
Sep 30, 2024
Sold by
Invesco Immobilien Fonds Iv Us Partner
Bought by
Punta Na Broadway Llc
Current Estimated Value
Purchase Details
Closed on
Dec 6, 2010
Sold by
Thor 512 Broadway Llc and % Thor Equities Llc
Bought by
Invesco Immobilien Fonds Iv U S Partner L P
Purchase Details
Closed on
Dec 29, 2008
Sold by
Henchie Holdings Llc and % Laytner'S Linen Shoppe Inc
Bought by
Thor 512 Broadway Llc and Laygrib Llc
Purchase Details
Closed on
Sep 13, 2000
Sold by
56 Crosby Associates Llc
Bought by
Henchie Holdings Llc
Create a Home Valuation Report for This Property
The Home Valuation Report is an in-depth analysis detailing your home's value as well as a comparison with similar homes in the area
Home Values in the Area
Average Home Value in this Area
Purchase History
| Date | Buyer | Sale Price | Title Company |
|---|---|---|---|
| Punta Na Broadway Llc | $26,900,000 | -- | |
| Invesco Immobilien Fonds Iv U S Partner L P | -- | -- | |
| Invesco Immobilien Fonds Iv U S Pa L P | -- | -- | |
| Invesco Immobilien Fonds Iv U S Pa L P | $55,000,000 | -- | |
| Thor 512 Broadway Llc | -- | -- | |
| Thor 512 Broadway Llc | -- | -- | |
| Henchie Holdings Llc | -- | -- | |
| Henchie Holdings Llc | -- | -- | |
| Henchie Holdings Llc | -- | -- |
Source: Public Records
Tax History Compared to Growth
Tax History
| Year | Tax Paid | Tax Assessment Tax Assessment Total Assessment is a certain percentage of the fair market value that is determined by local assessors to be the total taxable value of land and additions on the property. | Land | Improvement |
|---|---|---|---|---|
| 2025 | $746,433 | $6,448,151 | $1,080,599 | $5,367,552 |
| 2024 | $746,433 | $5,970,510 | $1,125,000 | $4,958,010 |
| 2023 | $678,150 | $5,528,250 | $1,125,000 | $4,403,250 |
| 2022 | $732,705 | $5,988,600 | $1,125,000 | $4,863,600 |
| 2021 | $818,208 | $7,045,650 | $1,125,000 | $5,920,650 |
| 2020 | $801,620 | $8,806,950 | $1,125,000 | $7,681,950 |
| 2019 | $754,768 | $8,181,000 | $1,125,000 | $7,056,000 |
| 2018 | $1,309,335 | $10,226,250 | $1,125,000 | $9,101,250 |
| 2017 | $1,369,130 | $10,764,450 | $1,125,000 | $9,639,450 |
| 2016 | $884,678 | $11,331,000 | $1,125,000 | $10,206,000 |
| 2015 | $200,336 | $12,013,200 | $1,125,000 | $10,888,200 |
| 2014 | $200,336 | $10,433,250 | $1,125,000 | $9,308,250 |
Source: Public Records
Map
Nearby Homes
- 56 Crosby St Unit 3A
- 508 Broadway Unit 4
- 508 Broadway Unit BUILDING
- 508 Broadway Unit 5
- 508 Broadway Unit 4/5
- 510 Broadway Unit 5
- 515 Broadway Unit 3A
- 515 Broadway Unit 4
- 514 Broadway Unit 5G
- 519 Broadway Unit PHC
- 519 Broadway Unit 2
- 519 Broadway
- 438 Broome St Unit 2
- 72 Mercer St Unit 5W
- 72 Mercer St Unit 2W
- 53 Crosby St Unit 1
- 45 Crosby St Unit 6-N
- 45 Crosby St Unit 6 North
- 430 Broome St Unit 4
- 39 1/2 Crosby St Unit 4
- 56 Crosby St Unit PHA
- 56 Crosby St Unit 5B
- 56 Crosby St Unit 5A
- 56 Crosby St Unit 4B
- 56 Crosby St Unit 3B
- 56 Crosby St Unit 2B
- 56 Crosby St Unit 2A
- 56 Crosby St
- 56 Crosby St Unit 3RF
- 56 Crosby St Unit 3R
- 56 Crosby St Unit 5BUNF
- 56 Crosby St Unit 5BUNFUR
- 56 Crosby St Unit 3A1
- 56 Crosby St Unit 3AB
- 508 Broadway
- 508 Broadway Unit ID1035011P
- 508 Broadway Unit ID1035002P
- 508 Broadway Unit ID1035001P
- 508 Broadway Unit 3
- 508 Broadway Unit 2